
Top 10 Malaysia's Imports in 2024 - Tendata
 Import News
 2025-09-19
Situated in Southeast Asia and trading closely with powerful economies such as mainland China, Singapore, Taiwan, Japan, Indonesia, and South Korea, Malaysia import data shows that the country purchased goods worth US$300.1 billion from global suppliers in 2024.
This figure reflects a 53.8% surge from the $189.6 billion registered in 2020. On a year-to-year basis, the overall value of Malaysia imports rose 12.8% compared with $266 billion in 2023.
According to the 2024 average exchange rate, the Malaysian ringgit depreciated by -0.3% against the US dollar. A weaker local currency made purchases priced in US dollars more costly once converted into ringgits, further influencing the structure of Malaysia import trends.
Malaysia's major import items include electronic integrated circuits, refined petroleum oils, crude oil, computers (including optical readers), and mobile devices such as smartphones. Combined, these five leading categories accounted for 37% of the nation's total Malaysia imports in 2024.
Globally, Malaysia import flows represented about 1.2% of the world's $24.09 trillion import total for that year.

Malaysia's Leading Import Partners
Latest trade data shows that 89.2% of Malaysia imports came from a small group of key suppliers:
1.Mainland China: 26.4%
2.Singapore: 13.1%
3.United States: 13.1%
4.Japan: 8.6%
5.Thailand: 5.7%
6.Saudi Arabia: 5.4%
7.South Korea: 4.7%
8.Taiwan: 4.4%
9.Indonesia: 2.24%
10.Germany: 2.17%
12.United Arab Emirates: 1.9%
13.Vietnam: 1.4%
From a regional perspective:
·Asia supplied nearly three-quarters (72.4%) of Malaysia imports.
·North America contributed 10.2%.
·Europe delivered 9.5%.
The remainder came from Oceania (2.9%), Africa (2.6%), and Latin America (2.4%).
With a population of 33.5 million, Malaysia import data for 2024 translates to around $9,000 per person, an increase compared to $8,050 in 2023.
1.Malaysia's Top 10 Imported Products in 2024
2.Electrical machinery, equipment: $86.1B (28.7%)
3.Mineral fuels including oil: $49B (16.3%)
4.Machinery including computers: $38.9B (13%)
5.Plastics, plastic articles: $9.1B (3%)
6.Vehicles: $8.1B (2.7%)
7.Optical, technical, medical apparatus: $7.2B (2.4%)
8.Gems, precious metals: $6.6B (2.2%)
9.Iron, steel: $5.9B (2%)
10.Aluminum: $5.4B (1.8%)
11.Organic chemicals: $4.8B (1.6%)
Together, these categories accounted for 73.7% of Malaysia imports in 2024.
Fastest-growing sectors:
1.Machinery including computers (+54.7%)
2.Gems & precious metals (+29.1%, led by gold)
3.Electrical machinery & equipment (+18.1%)
4.Declining categories:
5.Mineral fuels including oil (-3.5%)
6.Vehicles (-2.4%)
7.Iron & steel (-0.7%)
8.Malaysia Import Companies
For businesses targeting the Malaysia import market, finding trusted buyers is critical. Platforms like Tendata offer powerful tools such as HS code filters and keyword searches, enabling companies to identify verified clients, track purchase activity, and shorten the time needed for market entry.
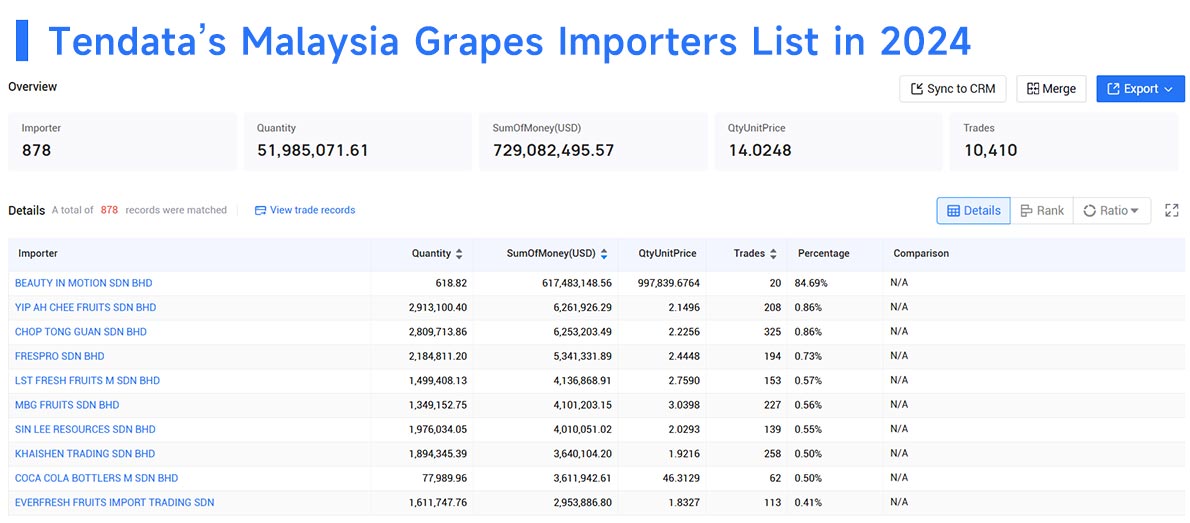
For instance, when researching demand for fruits like grapes, Tendata data reveals the top 10 importers in Malaysia for 2024:
1.Beauty In Motion Sdn Bhd (0.86%, $617.48M)
2.Yip Ah Chee Fruits Sdn Bhd (0.69%, $6.26M)
3.Chop Tong Guan Sdn Bhd (0.86%, $6.25M)
4.Frespro Sdn Bhd (0.73%, $5.34M)
5.LST Fresh Fruits M Sdn Bhd (0.73%, $4.14M)
6.MBG Fruits Sdn Bhd (0.57%, $4.1M)
7.Sin Lee Resources Sdn Bhd (0.56%, $4.01M)
8.Khaishen Trading Sdn Bhd (0.55%, $3.64M)
9.Coca Cola Bottlers M Sdn Bhd (0.5%, $3.61M)
10.Everfresh Fruits Import Trading Sdn Bhd (0.5%, $2.95M)
Final Insight
Whether you are an experienced trader or a newcomer, analyzing Malaysia import data provides valuable insights into supply chains, pricing trends, and opportunities. For more details on Malaysia's trade statistics, you can request a free demo from Tendata.
Category
Leave Message for Demo Request or Questions
















