
Leading Argentina's Imports by Country & Company in 2024 - Tendata
 Import News
 2025-10-11
Situated in the southern cone of South America, the Argentine Republic recorded total Argentina's import value of US$60.8 billion in 2024, representing goods purchased from suppliers across the globe.
This total reflects a 43.6% rise compared to $42.4 billion in 2020, showing that Argentina's import demand has grown considerably over the past five years.
However, compared with $73.7 billion in 2023, the overall import bill dropped by -17.5%, illustrating a cooling in Argentina's import activity.
During 2024, the Argentine peso weakened sharply—depreciating by 71.2% against the US dollar year over year. This sharp decline made Argentina's import products, typically priced in U.S. dollars, substantially more expensive in local terms.
Adding to this challenge, the domestic inflation rate soared to an average 229.8%, up from 133.5% in 2023, further straining the purchasing power of Argentine consumers and importers.

Regional Sources of Imports
From a regional standpoint, Latin American countries (excluding Mexico) accounted for the largest portion of Argentina's import value, supplying 34.4% of the overall total in 2024.
Suppliers in Asia contributed 32.4%, while Europe delivered 16.7%, and North America represented 14.4%.
Smaller amounts came from Africa (1.6%) and Oceania (0.5%), mostly from Australia and New Zealand.
Given Argentina's population of 47.2 million, the country's total Argentina's import value in 2024 equates to roughly $1,300 per person—slightly below the $1,500 per-capita figure recorded in 2023.
Top 10 Import Categories
Below are the product categories that represented the highest dollar values among Argentina's import items in 2024, along with their share of total imports:
1.Machinery including computers: US$9.7 billion (15.9%)
2.Vehicles: $9 billion (14.7%)
3.Electrical machinery & equipment: $6.1 billion (10.1%)
4.Mineral fuels including oil: $3.8 billion (6.2%)
5.Oil seeds: $3.3 billion (5.5%)
6.Organic chemicals: $3 billion (4.9%)
7.Plastics and plastic articles: $2.7 billion (4.4%)
8.Pharmaceuticals: $2.5 billion (4.1%)
9.Optical, technical, and medical apparatus: $1.8 billion (3%)
10.Other chemical goods: $1.6 billion (2.6%)
Together, these top ten categories made up 71.4% of Argentina's import spending in 2024.
Import Trends and Performance
The strongest growth among Argentina's import categories came from vehicles, which saw an increase of 9.3% year over year.
Imports of miscellaneous chemical products also rose by 4.4%.
By contrast, the sharpest declines were observed in:
1.Mineral fuels including oil (down -51.2%)
2.Oil seeds (down -41.7%)
3.Electrical machinery and equipment (down -24.7%)
Detailed Imports by Product Type
At the more specific 4-digit HS code level, Argentina's import market was dominated by:
1.Automobile parts and accessories (7.6%)
2.Soya beans (5.3%)
3.Cars (4.7%)
4.Refined petroleum oils (2.6%)
5.Phones including smartphones (2.4%)
6.Petroleum gases (2.1%)
7.Blood fractions including antisera (1.9%)
8.Medication mixes in dosage form (1.8%)
9.Trucks (1.5%)
10.Fertilizer mixtures (1.4%)
Key Importing Companies in Argentina
For businesses planning to enter Argentina's import market, identifying reliable buyers is crucial.
With Tendata's trade intelligence platform, users can search by product keywords or HS codes, explore historical import trends, and directly access contact information for thousands of verified companies — saving valuable time when entering Argentina's import network.
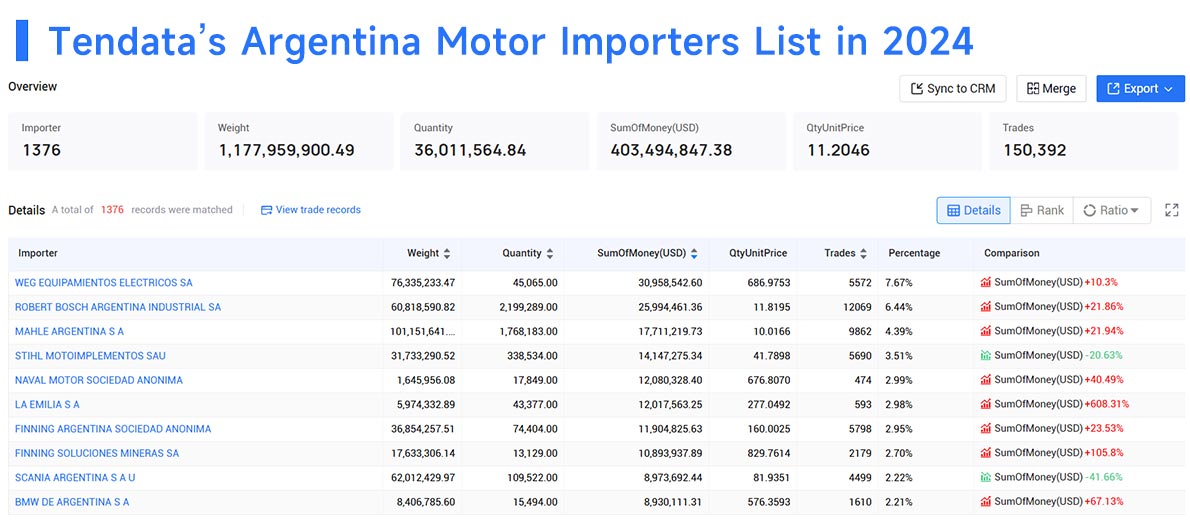
For instance, in the motor industry, Tendata data reveals the Top 10 Buyers in Argentina for 2024:
1.WEG Equipamientos Eléctricos SA (7.67%, $30.96M)
2.Robert Bosch Argentina Industrial SA (6.44%, $25.99M)
3.Mahle Argentina SA (4.39%, $17.71M)
4.Stihl Motoimplementos SAU (3.51%, $14.15M)
5.Naval Motor Sociedad Anónima (2.99%, $12.08M)
6.La Emilia SA (2.98%, $12.02M)
7.Finning Argentina Sociedad Anónima (2.95%, $11.9M)
8.Finning Soluciones Mineras SA (2.7%, $10.89M)
9.Scania Argentina SAU (2.22%, $8.97M)
10.BMW de Argentina SA (2.21%, $8.93M)
Exploring Argentina's Import Market
Whether you're an established international supplier or just beginning to explore new opportunities, analyzing Argentina's import data can uncover profitable market segments and potential trading partners.
To obtain deeper insights into Argentina's import performance and identify top buyers across product categories, request a free online demo from Tendata today.
Category
Leave Message for Demo Request or Questions
















