
Nepal's Top 10 Imports by Country & Company in 2024 - Tendata
 Import News
 2025-12-05
A landlocked nation in South Asia surrounded by China, India, Bangladesh and Bhutan, the Federal Democratic Republic of Nepal imported an estimated US$10.38 billion worth of goods in 2024.
That dollar amount results from a 6.5% increase from $9.75 billion in Nepalese spending 5 years earlier in 2020 and a 0.3% year-over-year flatlining gain from $10.35 billion during 2023.
Based on the average exchange rate for 2024, the Nepalese rupee weakened by -11.5% against the US dollar since 2020 and diluted by -1.3% from 2023 to 2024. Nepal's weaker local currency made Nepalese imports paid for starting from the diluted Nepalese rupee relatively more expensive for importers located in Nepal.
Nepal's top 5 imported products are processed petroleum oils, petroleum gases, iron ore reduced products, phone devices including smartphones, and hot-rolled iron or non-alloy steel products. Combined, the 5 most valuable imported goods in 2024 represent a concentration exceeding one quarter (28.6%) of the overall value of Nepalese imports.

Nepal's Main Product Suppliers by Geography
The latest available country-specific data from 2022 shows that 94.9% of products exported from Nepal was bought by importers in: India (71.9% of the Nepalese total), United States of America (11.3%), Germany (2.5%), Türkiye (2%), United Kingdom (1.8%), France (1%), Australia (0.8%), Japan (0.8%), Canada (0.8%), Italy (also 0.8%), Netherlands (0.6%) and Denmark (also 0.6%).
Applying a continental lens, 77.5% of Nepal's total imports by value was purchased from fellow Asian countries.
Smaller percentages came from sellers located in North America (12.1%), Europe (9.2%), Oceania (0.9%) led by Australia and New Zealand), Africa (0.2%), then Latin America (0.1%) excluding Mexico but including the Caribbean.
Given Nepal's population of 31.1 million people, its total $12.5 billion in 2024 imports translates to roughly $325 in yearly product demand from every person in the Himalayan country. That dollar metric exceeds the average $280 per capita one year earlier during 2023.
Nepal's Top 10 Imports
The following product groups represent the highest dollar value in Nepal's import purchases during 2024. Also shown is the percentage share each product category represents in terms of overall imports into Nepal.
1. Mineral fuels including oil: US$2.2 billion (21.5% of total imports)
2. Machinery including computers: $826.9 million (8%)
3. Electrical machinery, equipment: $771.3 million (7.4%)
4. Iron, steel: $731.7 million (7%)
5. Vehicles: $658.5 million (6.3%)
6. Plastics, plastic articles: $374 million (3.6%)
7. Cereals: $321.7 million (3.1%)
8. Pharmaceuticals: $271.9 million (2.6%)
9. Vegetables: $216.7 million (2.1%)
10. Optical, technical, medical apparatus: $181 million (1.7%)
Nepal's top 10 imports accounted for almost two-thirds (63.4%) of the overall value of its product purchases from other countries.
Imported vehicles posted the most greatest percentage increase in value among Nepal's top 10 import categories, up 35.1% from 2023 to 2024.
In second place were Nepal's imports of machinery including computers (up 16.3%) trailed by plastics, both as materials and items made from plastic, (up 12.9%) and vegetables (up 10%).
Year over year, iron and steel represent Nepal's greatest import decliners via a -21.5% drop.
Please note that the information presented below is at the more granular 4-digit level.
Finding Buyers in Nepal
For companies aiming to expand into Nepal's import market, identifying reliable Buyers is essential. With Tendata's advanced tools—such as keyword search and HS code filters—businesses can quickly pinpoint thousands of verified customers, check purchasing trends, and access contact details, drastically cutting the time needed for market entry.
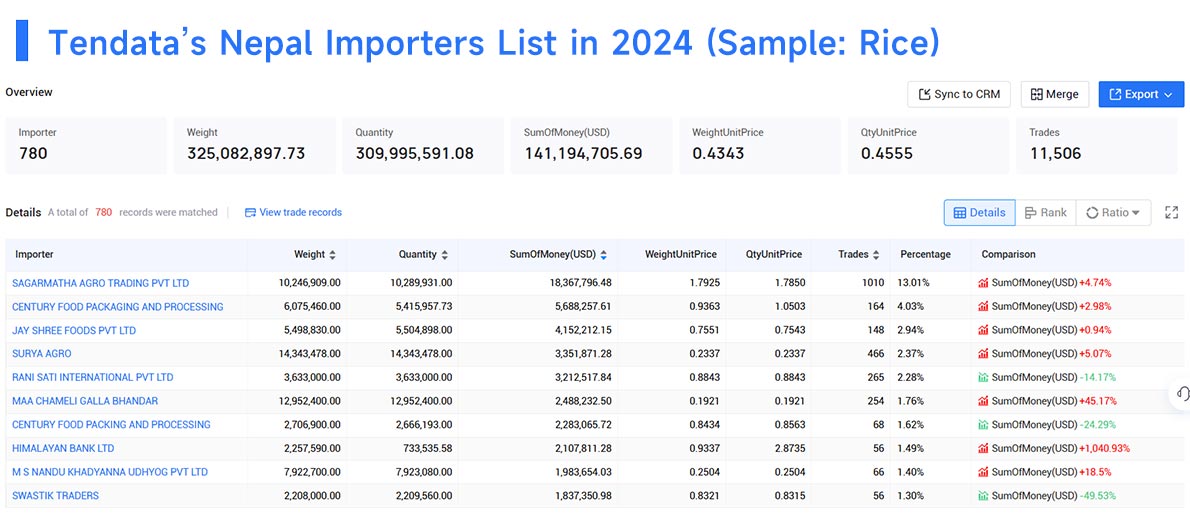
For example, when researching Rice demand, Tendata's platform can instantly reveal the top 10 Buyers in Nepal for 2024. >>Find More Nepal Buyers
1.SAGARMATHA AGRO TRADING PVT LTD(13.01%, $18.37 Million)
2.CENTURY FOOD PACKAGING AND PROCESSING(4.03%, $5.69 Million)
3.JAY SHREE FOODS PVT LTD(2.94%, $4.15 Million)
4.SURYA AGRO(2.37%, $3.35 Million)
5.RANI SATI INTERNATIONAL PVT LTD(2.28%, $3.21 Million)
6.MAA CHAMELI GALLA BHANDAR(1.76%, $2.49 Million)
7.CENTURY FOOD PACKING AND PROCESSING(1.62%, $2.28 Million)
8.HIMALAYAN BANK LTD(1.49%, $2.11 Million)
9.M S NANDU KHADYANNA UDHYOG PVT LTD(1.4%, $1.98 Million)
10.SWASTIK TRADERS(1.3%, $1.84 Million)
Whether you're a seasoned trader or a newcomer, using Nepal's import data can uncover valuable market opportunities. For more information on Nepal's import statistics or import data, contact Tendata for a free online demo.
Category
Leave Message for Demo Request or Questions
















