
South Korea's Import Market Overview in 2025 - Tendata
 Import News
 2026-02-25
In 2025, South Korea recorded a total South Korea's Import value of approximately US$632.5 billion. Compared with $615 billion in 2021, this represents a 2.7% increase over five years, highlighting the country's stable demand for overseas products.
On a year-over-year basis, South Korea's Import spending remained nearly unchanged, showing a slight 0.1% decline from $632.1 billion in 2024.
Based on the average exchange rate for 2025, the South Korean won depreciated by 4.1% against the US dollar. This currency movement made South Korea's Import purchases priced in US dollars relatively more expensive when converted into won, influencing overall procurement costs.
Meanwhile, domestic inflation measured by consumer prices rose 1.839% in 2025, slightly below the 2.322% recorded in 2024.

Major Suppliers Supporting South Korea's Import Demand
According to the latest trade statistics, 73.2% of South Korea's Import value came from the following leading supplier countries:
1. China (22.5%)
2. United States (11.7%)
3. Japan (7.7%)
4. Taiwan (5.12%)
5. Australia (5.08%)
6. Vietnam (5%)
7. Saudi Arabia (4.3%)
8. Germany (3.4%)
9. Malaysia (2.5%)
10. United Arab Emirates (2.2%)
11. Singapore (1.8%)
12. Indonesia (1.79%)
Regionally, 62.3% of South Korea's Import value was sourced from other Asian economies. North America contributed 14.1%, while Europe supplied 13.4%.
Additional shares originated from Oceania (5.6%), primarily Australia, New Zealand, and Papua New Guinea, followed by Latin America (2.9%, excluding Mexico but including the Caribbean) and Africa (1.7%).
With a population of approximately 51.7 million people, South Korea's Import total in 2025 translates to around $12,225 in imported goods per capita—slightly higher than the $12,200 recorded in 2024.
South Korea's Import Structure: Top 10 Product Categories
The following product categories generated the highest import values under South Korea's Import structure in 2025:
1. Mineral fuels including oil – US$140 billion (22.2%)
2. Electrical machinery and equipment – $127.5 billion (20.2%)
3. Machinery including computers – $74.7 billion (11.8%)
4. Optical, technical and medical apparatus – $24.7 billion (3.9%)
5. Ores, slag and ash – $20.8 billion (3.3%)
6. Vehicles – $20.6 billion (3.3%)
7. Organic chemicals – $13.6 billion (2.2%)
8. Gems and precious metals – $13.33 billion (2.1%)
9. Plastics and plastic products – $13.33 billion (2.1%)
10. Iron and steel – $11.8 billion (1.9%)
Together, these ten categories accounted for 72.9% of South Korea's Import expenditure in 2025, demonstrating a high concentration in energy, machinery, and industrial inputs.
The fastest-growing segment was gems and precious metals, which surged by 102.4% year over year, largely driven by increased gold purchases. Machinery including computers rose 13.2%, while optical and medical apparatus expanded 8.6%.
In contrast, iron and steel imports declined by 16.9%, and mineral fuels including oil dropped by 13.7%.
All figures above are calculated at the 2-digit Harmonized Tariff System (HTS) level, with more detailed analysis available at the 4-digit level.
Using South Korea's Import Data to Find Buyers
For businesses looking to enter South Korea's Import market, identifying reliable buyers is essential. Tendata's advanced search tools—such as keyword filtering and HS code analysis—enable companies to locate verified importers, evaluate purchasing trends, and access contact information efficiently.
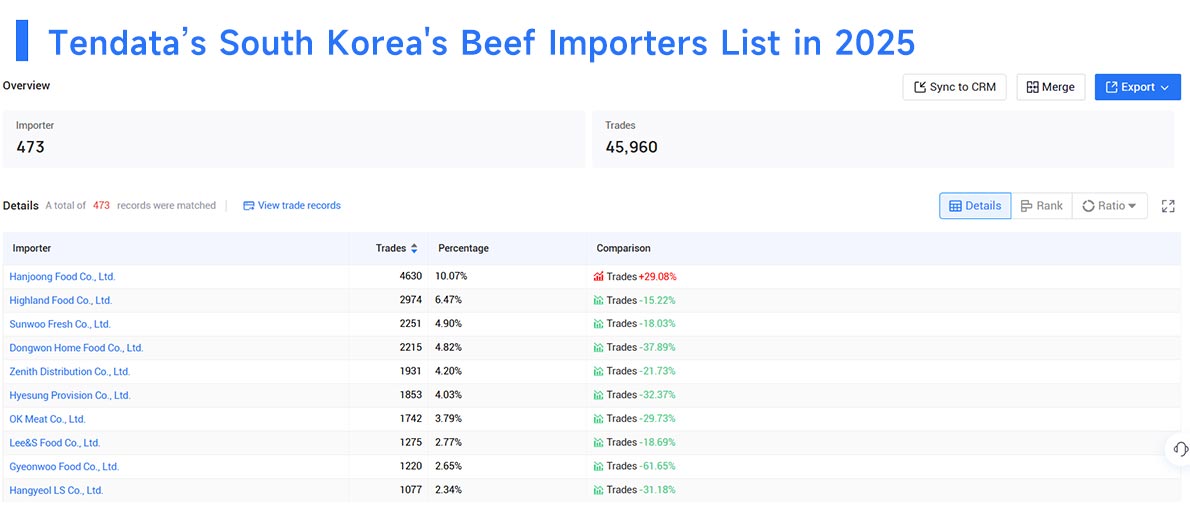
For instance, when analyzing beef demand, Tendata can quickly identify the top buyers in South Korea for 2025 >>Find More South Korea Buyers
1.Hanjoong Food Co., Ltd.(10.07%)
2.Highland Food Co., Ltd.(6.47%)
3.Sunwoo Fresh Co., Ltd.(4.9%)
4.Dongwon Home Food Co., Ltd.(4.82%)
5.Zenith Distribution Co., Ltd.(4.2%)
6.Hyesung Provision Co., Ltd.(4.03%)
7.OK Meat Co., Ltd.(3.79%)
8.Lee&S Food Co., Ltd.(2.77%)
9.Gyeonwoo Food Co., Ltd.(2.65%)
10.Hangyeol LS Co., Ltd.(2.34%)
>>Get A Free Demo<<
Whether you are an experienced exporter or new to the East Asian market, leveraging South Korea's Import data can help uncover valuable trade opportunities and accelerate market expansion.
Category
Leave Message for Demo Request or Questions
















