
Top 10 Australia's Imports by Country & Company in 2025 - Tendata
 Import News
 2026-03-03
In 2025, Australia recorded Australia's Imports totaling US$297.5 billion, reflecting the country's strong demand for overseas products.
Over a five-year span, Australia's Imports increased by 19.5% compared to the $248.9 billion spent in 2021. On a year-over-year basis, Australia's Imports also rose 4.6% from the $284.5 billion reported in 2024.
Based on the average exchange rate in 2025, the Australian dollar depreciated by 2.3% against the US dollar compared to the previous year. This currency movement made Australia's Imports, when priced in stronger US dollars, relatively more expensive after conversion into local currency.
Meanwhile, Australia's domestic inflation rate for average consumer prices stood at 2.55% in 2025, easing from 3.198% in 2024.
The seven most valuable goods within Australia's Imports were refined petroleum oils, passenger vehicles, gold, computers, trucks, smartphones and other phone devices, as well as packaged medicaments. Collectively, these products accounted for about 33.7% of the total value of Australia's Imports in 2025.

Major Suppliers Supporting Australia's Imports
Recent country-level data shows that 70.8% of Australia's Imports originated from the following economies:
· Mainland China (35.6%)
· United States of America (7.5%)
· Japan (5.2%)
· South Korea (5.1%)
· Thailand (4%)
· Germany (2.8%)
· Malaysia (2.7%)
· Singapore (2.2%)
· Vietnam (2.2%)
· India (1.8%)
· Italy (1.7%)
· Taiwan (1.3%)
From a regional perspective, Asian nations accounted for 62.9% of Australia's Imports in 2025. European partners supplied 17.1%, while North American exporters represented 13.4%.
Within Oceania, neighboring markets such as New Zealand and Papua New Guinea contributed 3.7% to Australia's Imports. Smaller portions came from Latin America (1.8%) and Africa (1.1%).
Given Australia's population of 27.5 million people, the total value of Australia's Imports in 2025 translates to roughly $10,850 per person in annual imported goods demand—higher than the approximately $10,400 per capita in 2024.
Australia's Top 10 Import Categories (2025)
The following product groups generated the highest value within Australia's Imports:
1.Machinery including computers: US$43 billion (14.5%)
2.Vehicles: $39.6 billion (13.3%)
3.Mineral fuels including oil: $34.5 billion (11.6%)
4.Electrical machinery and equipment: $34.5 billion (11.6%)
5.Gems and precious metals: $16.1 billion (5.4%)
6.Pharmaceuticals: $11.7 billion (3.9%)
7.Optical, technical and medical apparatus: $10.5 billion (3.5%)
8.Plastics and plastic articles: $7.1 billion (2.4%)
9.Articles of iron or steel: $6.6 billion (2.2%)
10.Furniture, bedding, lighting, signs and prefabricated buildings: $5.3 billion (1.8%)
Together, these top 10 categories represented 70.2% of the total value of Australia's Imports in 2025.
Among them, gems and precious metals recorded the fastest growth (up 78.4%), followed by electrical machinery and equipment (up 10.2%) and pharmaceuticals (up 7%).
In contrast, mineral fuels including oil declined by 9.1%, vehicles fell 7.1%, and iron or steel products dropped 3.2% year over year.
Note: All figures are calculated at the two-digit Harmonized Tariff System (HTS) code level. More detailed analysis is available at the four-digit level.
Finding Buyers in Australia
For businesses aiming to enter the Australian import market, identifying trustworthy buyers is essential. Using Tendata's advanced tools—such as keyword searches and HS code filters—companies can efficiently analyze Australia's Imports, identify verified customers, monitor purchasing trends, and obtain contact details, significantly shortening the time required for market expansion.
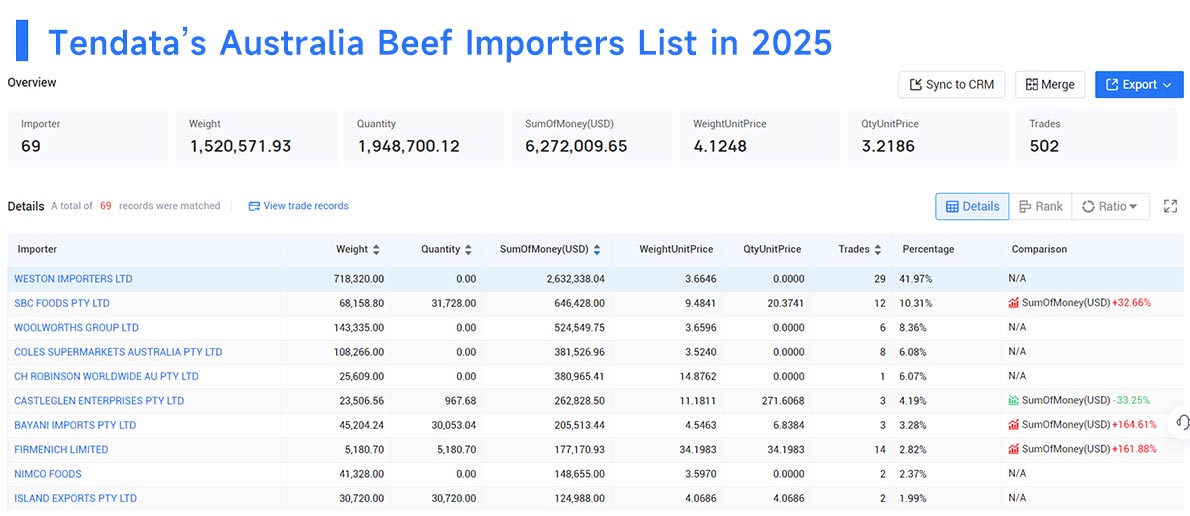
For example, when researching beef-related demand, Tendata can quickly display the top 10 buyers in Australia for 2024, helping exporters align their strategies with actual market demand.
1.WESTON IMPORTERS LTD(41.97%, $2.63 Million)
2.SBC FOODS PTY LTD(10.31%, $0.65 Million)
3.WOOLWORTHS GROUP LTD(8.36%, $0.52 Million)
4.COLES SUPERMARKETS AUSTRALIA PTY LTD(6.08%, $0.38 Million)
5.CH ROBINSON WORLDWIDE AU PTY LTD(6.07%, $0.38 Million)
6.CASTLEGLEN ENTERPRISES PTY LTD(4.19%, $0.26 Million)
7.BAYANI IMPORTS PTY LTD(3.28%, $0.21 Million)
8.FIRMENICH LIMITED(2.82%, $0.18 Million)
9.NIMCO FOODS(2.37%, $0.15 Million)
10.ISLAND EXPORTS PTY LTD(1.99%, $0.12 Million)
Whether you are an experienced trader or just entering international commerce, leveraging detailed data on Australia's Imports can help uncover valuable business opportunities. Contact Tendata today to request a free online demo and explore comprehensive Australian import statistics.
Category
Leave Message for Demo Request or Questions
















