
Overview of Leading Norway's Imports in 2025 - Tendata
 Import News
 2026-03-18
Located in Northern Europe and sharing a long border with Sweden, the Kingdom of Norway recorded total Norway's imports of approximately US$107.3 billion in 2025.
This figure reflects an 8.8% increase compared with $98.6 billion in 2021. On a year-over-year basis, Norway's imports also expanded by 8.7%, rising from $98.7 billion in 2024.
Based on average exchange rates in 2025, the Norwegian krone appreciated by 3.5% against the US dollar compared with 2024. This stronger currency made Norway's imports priced in US dollars relatively more affordable for domestic buyers.
Meanwhile, Norway's inflation rate for consumer prices averaged 2.6% in 2025, slightly lower than the 3.1% recorded in 2024, helping stabilize the cost structure of Norway's imports.

Key Suppliers Behind Norway's Imports
Recent data shows that about 67.8% of Norway's imports originated from major global trading partners. The leading suppliers included China (11.9%), Germany (11.8%), and Sweden (10%).
Other important contributors to Norway's imports were the United States (7.1%), Denmark (4.2%), Netherlands (4.12%), United Kingdom (4.08%), Poland (3.9%), Italy (3.4%), France (2.9%), Finland (2.3%), and Brazil (2.1%).
From a regional perspective, European countries accounted for 61.3% of Norway's imports, followed by Asia (21.9%) and North America (9.2%).
Smaller shares of Norway's imports came from Latin America (3.6%), Africa (1.3%), and Oceania (0.3%).
Although Norway is not part of the European Union, 55.1% of Norway's imports were sourced from EU member states in 2025, slightly higher than the previous year.
With a population of about 5.6 million, total Norway's imports in 2025 equate to roughly $19,100 per capita, up from $17,700 in 2024.
Norway's Imports by Top Product Categories
The following product groups represent the largest share of Norway's imports in 2025:
1.Machinery including computers – $16.2 billion (15.1%)
2.Vehicles – $12.3 billion (11.5%)
3.Electrical machinery and equipment – $10.7 billion (9.9%)
4.Mineral fuels including oil – $5.6 billion (5.2%)
5.Articles of iron or steel – $5.3 billion (4.9%)
6.Optical, technical, and medical instruments – $3.6 billion (3.4%)
7.Pharmaceuticals – $3.2 billion (3%)
8.Furniture, bedding, lighting, prefabricated buildings – $2.89 billion (2.7%)
9.Plastics and plastic products – $2.85 billion (2.7%)
10.Inorganic chemicals – $2.4 billion (2.3%)
Together, these categories made up 60.7% of total Norway's imports, highlighting the country's strong reliance on industrial goods, technology, and transportation equipment.
Growth Trends in Norway's Imports
Among the major sectors, vehicles saw the fastest growth, with spending on this category within Norway's imports increasing by 22.2% from 2024 to 2025.
Other fast-growing segments in Norway's imports included:
1.Iron and steel products (+14.8%)
2.Electrical machinery and equipment (+13.1%)
3.Optical and medical devices (+12.4%)
The only category that declined within Norway's imports was mineral fuels, which fell by 15% compared with 2024.
Detailed Breakdown of Norway's Imports
At the more detailed 4-digit HS code level, the most significant products within Norway's imports included:
1.Passenger cars (6.9%)
2.Computers and optical readers (3.3%)
3.Refined petroleum products (3.3%)
4.Mobile phones and smartphones (2.3%)
5.Packaged pharmaceuticals (1.9%)
6.Trucks (1.7%)
7.Iron or steel structures (1.7%)
8.Nickel matte or oxide sinters (1.6%)
9.Aluminum oxide or hydroxide (1.3%)
10.Valves and similar mechanical devices (1.3%)
These figures show that Norway's imports are heavily concentrated in automotive, electronics, industrial materials, and healthcare sectors.
How to Find Buyers Through Norway's Imports Data
For companies looking to enter the Norwegian market, leveraging Norway's imports data is essential for identifying reliable buyers.
With Tendata's trade intelligence platform, businesses can use keyword searches and HS code filters to analyze Norway's imports, discover verified buyers, track purchasing trends, and access direct contact details—significantly reducing the time required for market entry.
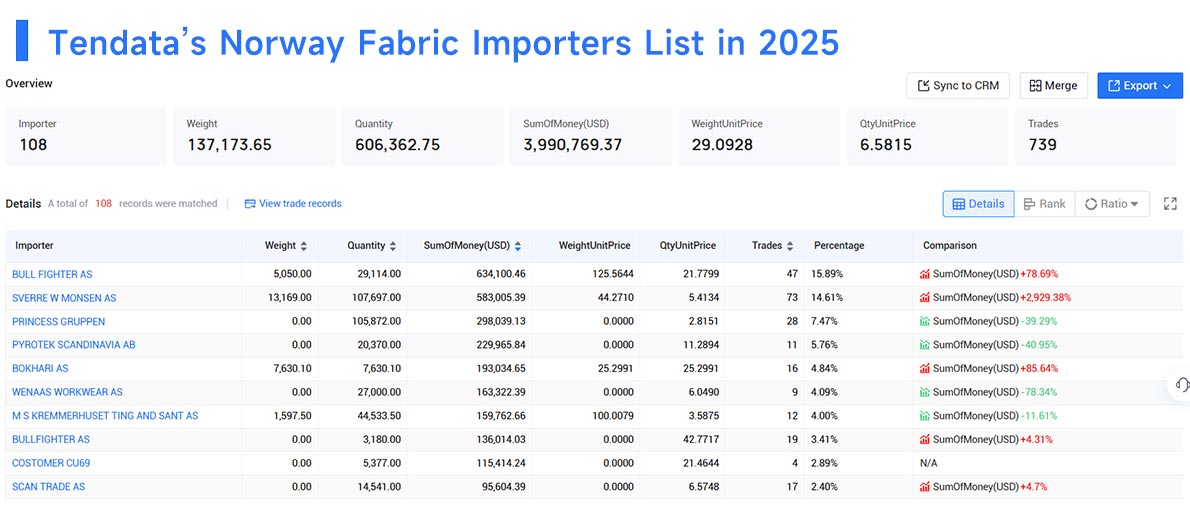
For example, when analyzing fabric demand, Tendata can quickly provide a list of the top buyers connected to Norway's imports in 2025, including:>>Find More Norway Buyers
1.BULL FIGHTER AS(15.89%, $0.63 Million)
2.SVERRE W MONSEN AS(14.61%, $0.58 Million)
3.PRINCESS GRUPPEN(7.47%, $0.3 Million)
4.PYROTEK SCANDINAVIA AB(5.76%, $0.23 Million)
5.BOKHARI AS(4.84%, $0.19 Million)
6.WENAAS WORKWEAR AS(4.09%, $0.16 Million)
7.M S KREMMERHUSET TING AND SANT AS(4%, $0.16 Million)
8.BULLFIGHTER AS(3.41%, $0.14 Million)
9.COSTOMER CU69(2.89%, $0.12 Million)
10.SCAN TRADE AS(2.4%, $0.1 Million)
Whether you're a seasoned trader or a newcomer, using Norwegian import data can uncover valuable market opportunities. For more information on Norwegian import statistics or import data, contact Tendata for a free online demo.
Category
Leave Message for Demo Request or Questions
















