
Top 10 Global Goat Import by Country & Company - Tendata
 Import News
 2026-03-26
Keypoints
· Strong Market Scale with Active Trade Flows
The global goat imports market in 2025 includes 6,050 importers across 97 countries, generating a total trade value of USD 375.64 million from 90,613 transactions. This reflects a highly active and liquid market with frequent cross-border trade.
· High Demand Concentration in Emerging Markets
Vietnam (29.02%) and Colombia (18.44%) dominate global goat imports, followed by India, Mexico, and Pakistan. The top three countries account for over 57% of total import value, indicating strong regional clustering in Asia and Latin America.
· Buyer Structure: Top Importers Drive Nearly Half of Trade
Leading companies such as CÔNG TY TNHH SAO VÀNG, PRODUCTOS ROCHE S A, and KOBA COLOMBIA S A S collectively contribute close to 47% of total goat imports, showing a highly concentrated buyer landscape at the top tier.
· Product Structure Dominated by Leather-Related HS Codes
HS Code 41131000 alone accounts for 23.04% of total goat imports, highlighting that global trade is primarily driven by leather and industrial applications rather than direct consumption.
· Balanced Market: Large Buyers + Long-Tail Opportunities
While top importers and countries dominate volume, a wide base of mid- and small-scale buyers ensures stable demand in goat imports, creating opportunities for exporters to diversify risk and expand market reach.
· Data-Driven Buyer Identification is Critical
With fragmented demand beyond top players, using trade data tools like Tendata helps exporters identify active buyers, track purchasing cycles, and improve conversion efficiency in the global goat imports market.

The global goat imports market plays an important role in supporting food supply chains, leather manufacturing, agriculture, and related industrial sectors worldwide. From raw goat hides and skins to processed leather products, goat imports contribute to both consumer markets and downstream manufacturing industries, driving cross-border trade activity.
Understanding the top goat importing countries, key buyers, and major HS codes provides valuable insight into global goat imports demand patterns, supply chain structures, and evolving trade dynamics. This article explores the goat imports market based on global trade data, highlighting leading importing countries, major importers, product categories, and key trends.
Global Goat Imports Data: 2025 Overview
Global goat imports activity in 2025 reflects a moderately fragmented yet steadily expanding market, driven by consistent demand across food, livestock, and agricultural supply chains.
Based on available trade data, the sector includes 6,050 active importers across 97 countries, generating a total import value of $375.64 million from 90,613 transactions, indicating a broad and active trading network.
This wide participation highlights the decentralized nature of goat imports, where no single market dominates globally, but regional demand—particularly in the Middle East and Asia—plays a key role in shaping trade flows.
List of Major Goat Importing HS Codes
According to Tendata global trade data, here is the list of top goat HS Codes in 2025:
1.HS Code:41131000(23.04%,$86,327,865.98):Leather further prepared after tanning or crusting (incl. parchment-dressed leather), of goats or kids, without wool or hair on, whether or not split (excluding chamois leather, patent leather and patent laminated leather, and metallised leather)
2.HS Code:41062100(4.97%,$18,614,763.45):Hides and skins of goats or kids, in the wet state incl. wet-blue, tanned, without wool on, whether or not split (excluding further prepared and pre-tanned only)
3.HS Code:41039010(2.42%,$9,065,936.57): RAW HIDES AND SKINS OF GOATS OR KIDS, LIMED, PICKLED OR OTHERWISE PRESERVED, WHETHER OR NOT DEHAIRING OR SPLIT (EXCL. PARCHMENT-DRESSED)
4.HS Code:41062200(0.71%,$2,646,507.37): Hides and skins of goats or kids, in the dry state crust, without wool on, whether or not split (excluding further prepared and pre-tanned only)
5.HS Code:41062201(0.64%,$2,384,648.58):Goat hides and skins, in the dry crust state, depilated, incl. divided (excl. prepared in another way or only pre-tanned): in the dry state (crust)
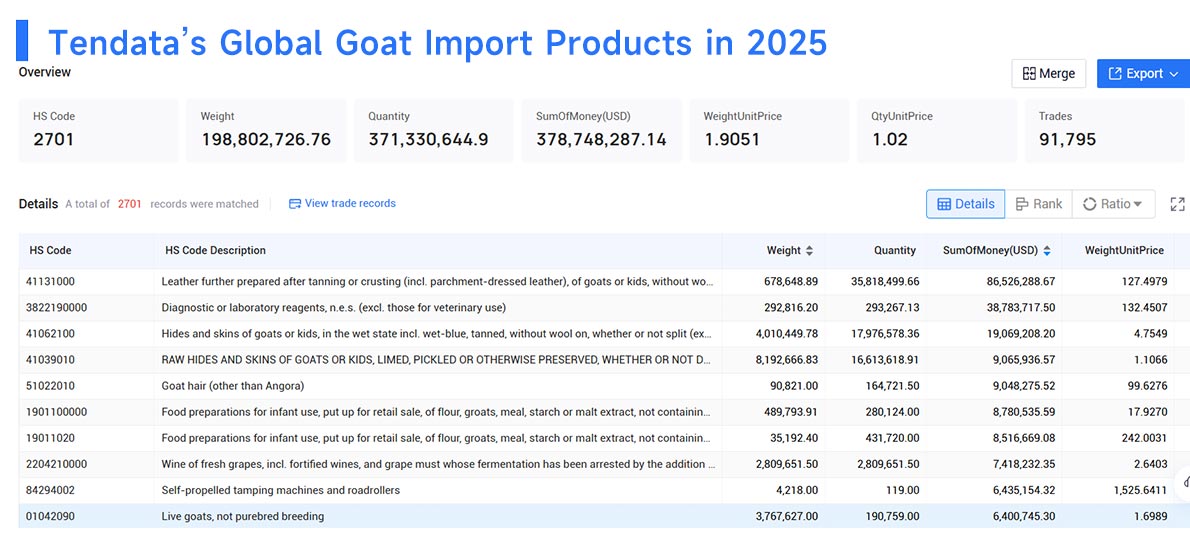
The global goat import market is strongly defined by its product structure at the HS code level, with a clear concentration in processed and semi-processed leather categories. According to Tendata trade data, HS Code 41131000 dominates the market, accounting for 23.04% of total imports (USD 86.33 million). This category covers goat leather further prepared after tanning, highlighting the significant role of downstream leather processing and manufacturing industries in driving demand.
Other important HS codes include 41062100 (4.97%, USD 18.61 million), which represents wet-state tanned goat hides, and 41039010 (2.42%, USD 9.07 million), covering raw or preserved goat skins. These categories indicate steady demand across different stages of the supply chain—from raw materials to semi-processed inputs. Meanwhile, smaller shares are held by 41062200 and 41062201, both related to dry-state crust goat hides, reflecting niche but consistent demand in specialized processing segments.
This HS code distribution shows that goat imports are heavily skewed toward leather and industrial applications rather than direct consumption, with value concentrated in higher-processed products.For exporters, this means focusing on value-added processing capabilities and aligning product specifications with buyer requirements in the leather industry can significantly improve competitiveness and margins.
Top Goat Importing Countries
According to Tendata global trade data, below is the list of major goat importing countries in 2025:
1.Vietnam(29.02%,$109,015,787.91)
2.Colombia(18.44%,$69,272,725.51)
3.India(9.74%,$36,596,141.10)
4.Mexico(7.84%,$29,466,005.90)
5.Pakistan(6.84%,$25,681,824.62)
6.Indonesia(6.57%,$24,665,355.18)
7.Brazil(2.46%,$9,243,066.36)
8.Bangladesh(2.42%,$9,100,601.16)
9.Ukraine(2.10%,$7,879,217.98)
10.Kazakhstan(2.03%,$7,621,796.50)
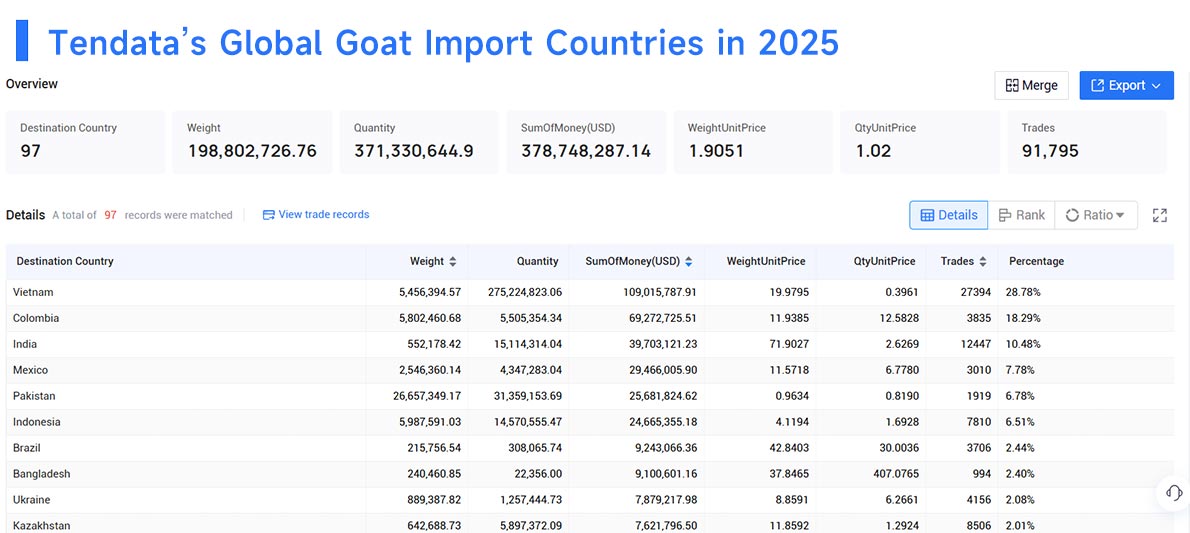
The global goats import market in 2025 reveals a clear concentration of demand across key emerging economies, with Asia and Latin America leading overall import activity. According to Tendata trade data, Vietnam ranks as the largest goat imports country, accounting for 29.02% of total imports (USD 109.02 million), significantly ahead of other markets. It is followed by Colombia (18.44%, USD 69.27 million) and India (9.74%, USD 36.60 million). Together, these top three countries contribute over 57% of global goat import value, indicating a strong regional clustering of demand.
Other important importing countries include Mexico, Pakistan, and Indonesia, each holding shares between 6% and 8%, reflecting steady consumption growth and expanding supply chain needs in these regions. Meanwhile, Brazil, Bangladesh, and Ukraine represent smaller but consistent markets, providing additional diversification opportunities for exporters.
This distribution pattern highlights a dual-structure market: dominant high-volume countries that drive global trade flows, and a broader base of mid- and small-scale importers that sustain long-term demand. For exporters, prioritizing leading markets like Vietnam and Colombia can accelerate market entry, while leveraging trade data to identify emerging buyers in secondary markets can help build a more resilient export strategy.
Top Global Goat Importers in 2025
According to Tendata global trade data, here is the list of top goat importers worldwide in 2025:
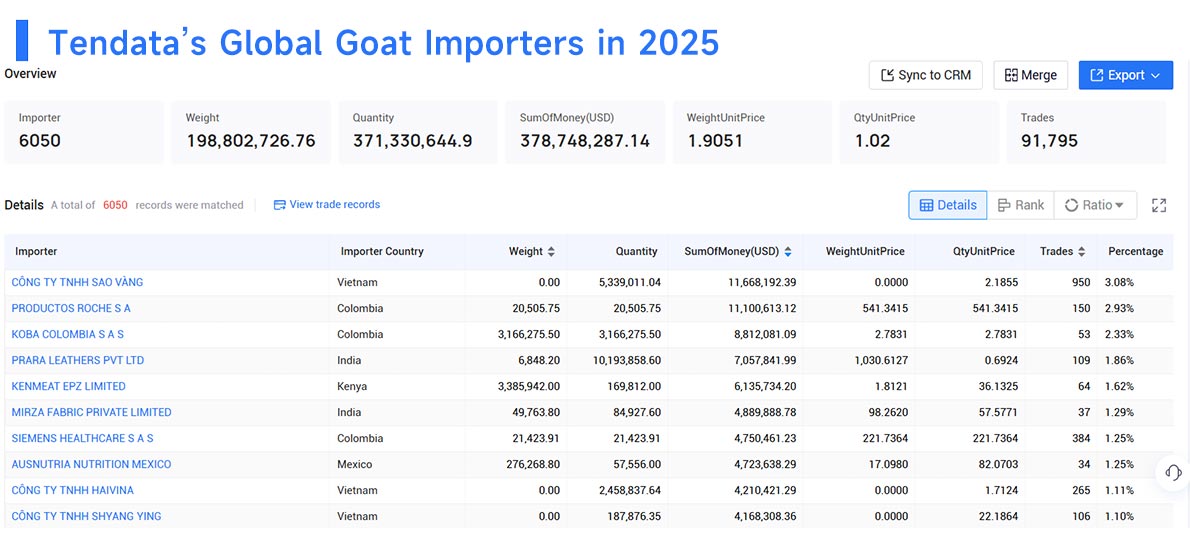
1.CÔNG TY TNHH SAO VÀNG(17.48%,$11,668,192.39)
2.PRODUCTOS ROCHE S A (16.63%,$11,100,613.12)
3.KOBA COLOMBIA S A S(13.20%,$8,812,081.09)
4.PRARA LEATHERS PVT LTD(10.07%,$6,723,768.19)
5.KENMEAT EPZ LIMITED(9.19%,$6,135,734.20)
6.SIEMENS HEALTHCARE S A S(7.12%,$4,750,461.23)
7.AUSNUTRIA NUTRITION MEXICO(7.08%,$4,723,638.29)
8.MIRZA FABRIC PRIVATE LIMITED(6.67%,$4,451,905.48)
9.CÔNG TY TNHH HAIVINA(6.31%,$4,210,421.29)
10.CÔNG TY TNHH SHYANG YING(6.25%,$4,168,308.36)
How to Find Goat Import Data with Tendata
To effectively access and analyze goat imports data, businesses can rely on professional trade intelligence platforms such as Tendata, which provide comprehensive, real-time global customs data and buyer insights. By simply entering keywords like “goat,” related HS codes, or specific product descriptions, users can quickly retrieve detailed import records, including transaction values, shipment volumes, supplier–buyer relationships, and pricing trends.
One of the key advantages of Tendata is its multi-dimensional data coverage, aggregating information from customs authorities, ports, and logistics sources worldwide, ensuring both accuracy and depth. The platform enables users to identify active goat importers, analyze purchasing frequency, track competitor shipments, and uncover high-potential markets. It also provides direct contact details of buyers, allowing exporters to move from data analysis to customer outreach efficiently.
In practice, exporters can use Tendata to filter goat imports data by country, company, HS code, or time period, helping them pinpoint buyers with consistent demand and optimize market entry strategies. This data-driven approach not only reduces blind outreach but also improves conversion rates by targeting verified, high-intent importers in the global goat trade network.
Final Words
The global goat import market in 2025 presents a data-rich, opportunity-driven landscape, shaped by concentrated demand in key countries and a structured network of active buyers. With over 6,000 importers across nearly 100 countries and a total trade value exceeding USD 375 million, the market offers both scale and diversity for exporters targeting international growth.
What stands out is the clear dual structure: dominant markets like Vietnam and Colombia drive large volumes, while a wide base of mid-tier buyers ensures continuous and repeat demand. At the same time, the strong presence of leather-related HS codes highlights the importance of industrial applications, signaling that value-added processing remains a key competitive edge.
For exporters, success in the goat imports market depends on moving beyond traditional approaches. Using reliable trade data to identify high-frequency buyers, analyze purchasing behavior, and validate real demand is essential. With platforms like Tendata, businesses can turn complex global trade data into actionable insights—helping them target the right markets, connect with verified buyers, and build sustainable, long-term trade relationships in an increasingly competitive environment.
FAQ
1. What is the current size of the global goat imports market?
The global goat imports market in 2025 includes 6,050 importers across 97 countries, with a total value of USD 375.64 million and over 90,000 transactions.
2. Which countries lead global goat imports?
Vietnam and Colombia dominate global goat imports, followed by India, Mexico, and Pakistan, with strong demand concentration in Asia and Latin America.
3. What products dominate goat imports?
Most goat imports are leather-related products, especially HS Code 41131000, which accounts for over 23% of total trade value.
4. How can I find reliable goat imports buyers?
Using Tendata, you can analyze goat imports data by HS code, country, or company to identify active buyers with consistent purchasing behavior.
5. How does Tendata support goat imports analysis?
Tendata helps businesses track goat imports trends, identify high-value buyers, and optimize export strategies through data-driven insights.
Category
Leave Message for Demo Request or Questions
















