
Top 10 Global Imported Alcohol by Country & Company & Products-Tendata
 Import News
 2026-03-30
Keypoints
·Strong Market Scale with High Trade Activity
The global imported alcohol market reached USD 14.3 billion, supported by 29,718 importers across 142 countries and over 593,830 transactions. This highlights the strong liquidity of the imported alcohol market, with frequent cross-border trade and stable demand cycles.
· High Demand Concentration in Emerging Economies
Countries such as India (31.64%) and Brazil (23.15%) dominate global imported alcohol imports, together accounting for more than 54% of total market value. Russia, Colombia, and Mexico form a strong second tier, reinforcing the growing role of emerging markets in imported alcohol consumption.
· Dual Market Structure: Industrial vs. Consumer Demand
The imported alcohol sector is divided between industrial-grade alcohol (e.g., HS 22072000, 22071001) and consumer beverages (e.g., wine and whisky under HS 22042100 and 22083020). This reflects diversified demand across both manufacturing and lifestyle-driven imported alcohol markets.

Overview of the Global Imported Alcohol Market
The global imported alcohol market plays a vital role in supporting retail, hospitality, tourism, and industrial sectors worldwide. From bulk ethyl alcohol used in pharmaceuticals and manufacturing to high-value beverages such as wine, whisky, and premium spirits, imported alcohol is deeply embedded in both consumer lifestyles and industrial supply chains. As demand expands across emerging and developed economies, imported alcohol trade continues to drive international revenue growth.
Global Imported Alcohol Data: 2025 Analysis
The global imported alcohol market in 2025 demonstrates strong trade intensity and broad geographic participation, reflecting its role as a high-demand consumer and hospitality-driven commodity. With 29,718 importers across 142 countries, the market shows a highly diversified buyer base spanning both mature economies and emerging consumption regions. Total import value reached USD 14.31 billion, generated from 593,830 trade transactions, indicating frequent cross-border shipments and stable replenishment cycles.
List of Major Importing HS Codes of Global Imported Alcohol
According to Tendata global trade data, here is the list of top HS Codes of Imported Alcohol in 2025
1.HS Code:22072000(11.0%, $1.57 Billion):Ethyl alcohol and other spirits, denatured, of any strength.
2.HS Code:22042100(5.7%, $0.82 Billion):Wine of fresh grapes, incl. fortified wines, and grape must whose fermentation has been arrested by the addition of alcohol, in containers of <= 2 l (excl. sparkling wine).
3.HS Code:22071001(1.77%, $0.25 Billion):Undenatured ethyl alcohol, of an alcoholic strength by volume of >= 80%
4.HS Code:22083020(1.73%, $0.25 Billion):Whiskies
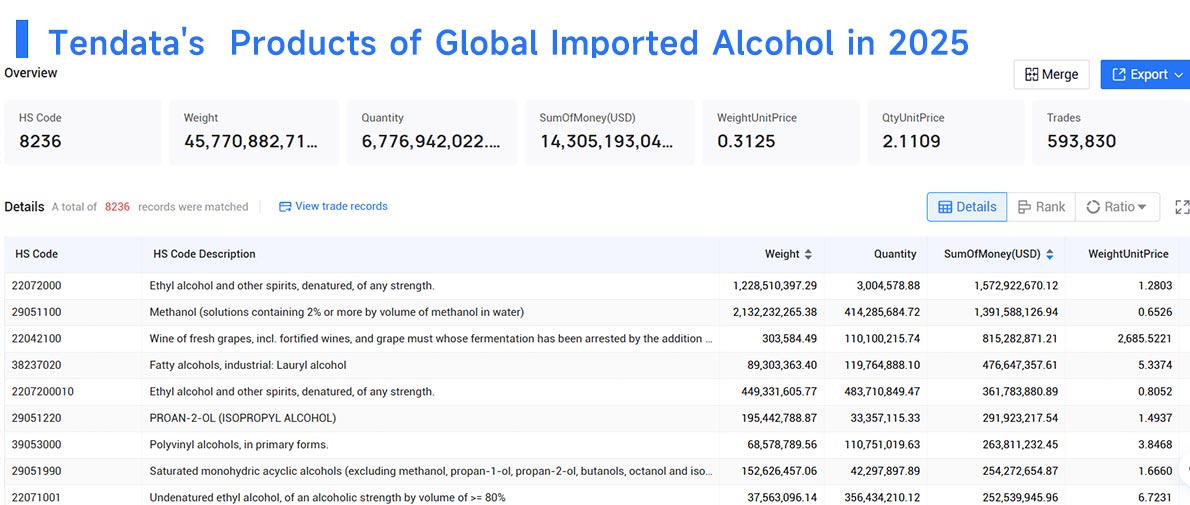
The HS code distribution highlights a dual-structure market: on one side, large-volume industrial alcohol supporting multiple downstream industries; on the other, high-value consumer beverages such as wine and whisky driven by lifestyle and premium consumption trends. This segmentation provides exporters with clear direction—targeting either bulk industrial demand or margin-driven branded alcohol markets depending on their competitive positioning.
Top Importing Countries of Global Imported Alcohol
According to Tendata global trade data, below is the list of major auto part importing countries in 2025:
1.India(31.64%, $4525.75 Million)
2.Brazil(23.15%, $3312.17 Million)
3.Russia(8.37%, $1196.78 Million)
4.Colombia(8.23%, $1177.72 Million)
5.Mexico(6.76%, $967.29 Million)
6.Vietnam(4.74%, $678.77 Million)
7.Uruguay(2.02%, $288.59 Million)
8.Indonesia(1.82%, $260.50 Million)
9.Philippines(1.54%, $220.94 Million)
10.Peru(1.53%, $219.26 Million)
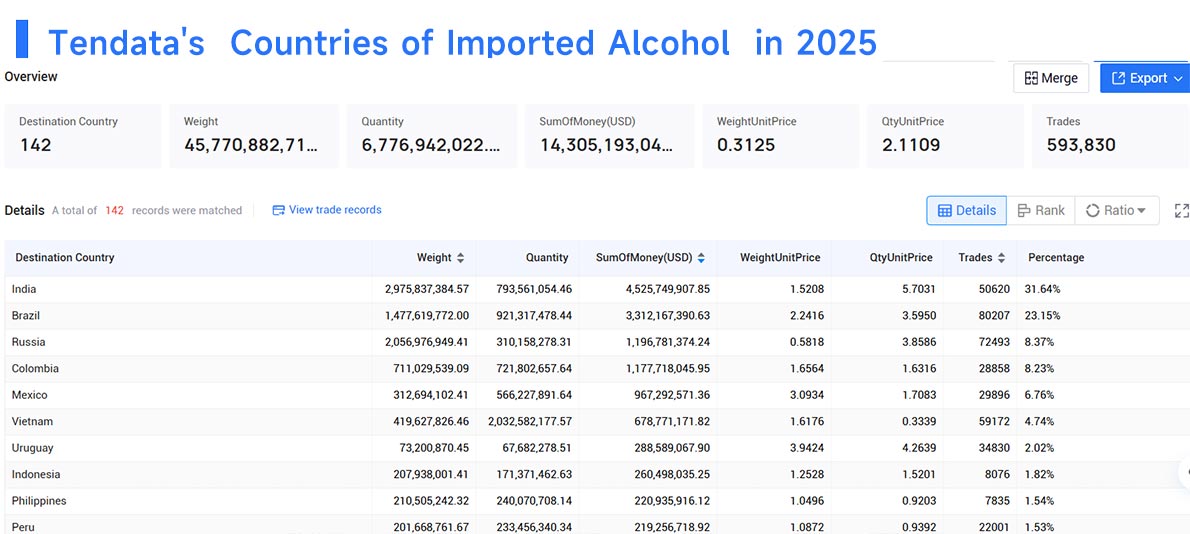
According to Tendata global trade data, the imported alcohol market in 2025 shows a clear concentration in a few high-demand countries, with emerging economies playing a dominant role in driving global consumption.
India leads the global imported alcohol market with a 31.64% share, reaching USD 4.53 billion, making it the largest and most influential importer. This reflects strong domestic demand driven by a growing middle class, urbanization, and expanding retail and hospitality sectors.
Brazil ranks second with 23.15% (USD 3.31 billion), supported by a well-established distribution network and a large consumer base with rising demand for premium and imported alcoholic beverages.
A second tier of importers includes Russia (8.37%) and Colombia (8.23%), both showing stable and consistent import demand. These markets are characterized by strong local consumption habits and reliance on imported brands to meet diverse consumer preferences.
Mexico (6.76%) and Vietnam (4.74%) further highlight the importance of emerging markets, where economic growth and lifestyle changes are accelerating alcohol imports, particularly in urban centers and tourism-driven regions.
Smaller but still relevant markets such as Uruguay (2.02%), Indonesia (1.82%), Philippines (1.54%), and Peru (1.53%) collectively contribute to market diversification, indicating steady expansion across Latin America and Southeast Asia.
Overall, the imported alcohol trade landscape in 2025 is highly concentrated yet geographically diverse, with the top two countries accounting for over 54% of total import value. This structure highlights clear opportunities for exporters to prioritize high-volume markets while simultaneously exploring fast-growing emerging economies for long-term expansion.
Top Global Importers of Imported Alcohol in 2025
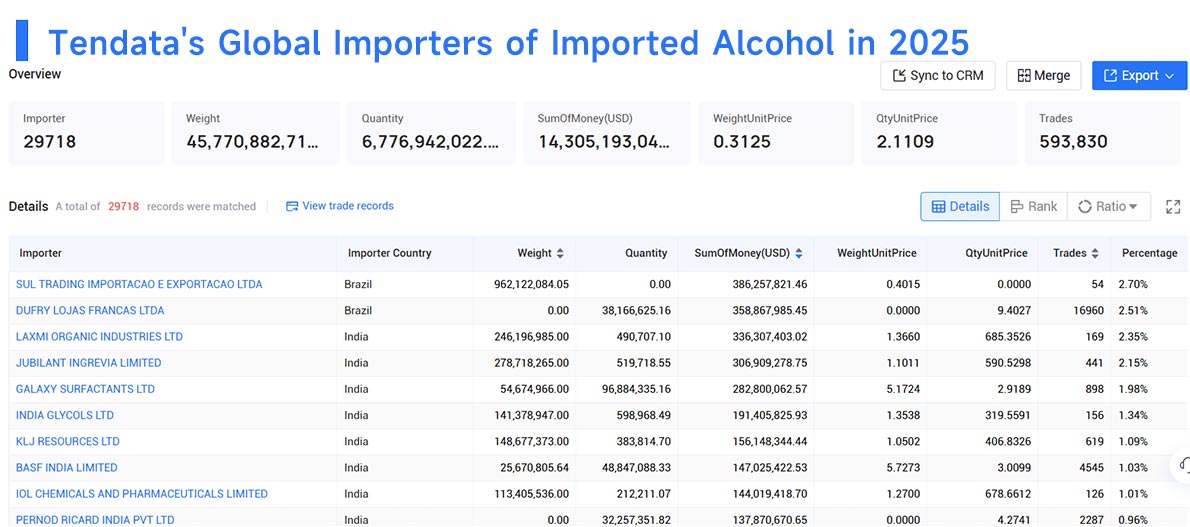
According to Tendata global trade data, here is the list of top importers of imported alcohol worldwide in 2025:
1.SUL TRADING IMPORTACAO E EXPORTACAO LTDA(2.70%, $386.26 Million)
2.DUFRY LOJAS FRANCAS LTDA(2.51%, $358.87 Million)
3.LAXMI ORGANIC INDUSTRIES LTD(2.35%, $336.31 Million)
4.JUBILANT INGREVIA LIMITED(2.15%, $306.91 Million)
5.GALAXY SURFACTANTS LTD(1.98%, $282.80 Million)
6.INDIA GLYCOLS LTD(1.34%, $191.41 Million)
7.KLJ RESOURCES LTD(1.09%, $156.15 Million)
8.BASF INDIA LIMITED(1.03%, $147.03 Million)
9.IOL CHEMICALS AND PHARMACEUTICALS LIMITED(1.01%, $144.02 Million)
10.PERNOD RICARD INDIA PVT LTD(0.96%, $137.87 Million)
How to find Products Import Data of Global Imported Alcohol ?
With Tendata, users can go beyond basic data lookup and Identify active imported alcohol buyers by country and product category.This end-to-end data workflow—from HS code identification to buyer analysis—allows exporters to move from market research to customer acquisition, making Tendata a practical tool for building a data-driven strategy in the global imported alcohol trade.
Final Words
The global imported alcohol market in 2025 reflects a dynamic balance between large-scale industrial demand and rapidly evolving consumer preferences. With over 29,000 importers across 142 countries and a total trade value exceeding USD 14.3 billion, the market demonstrates both strong liquidity and wide geographic reach. Leading importers such as India and Brazil dominate overall demand, while emerging markets in Latin America and Southeast Asia continue to expand their share, driven by rising incomes and changing consumption habits.
The coexistence of bulk industrial alcohol and premium beverages highlights clear strategic paths for exporters—either focusing on volume or targeting high-margin segments within the imported alcohol market.
FAQ
Q1: What is the total size of the global imported alcohol market in 2025?
The global imported alcohol market includes 29,718 importers across 142 countries, with a total trade value of USD 14.3 billion and 593,830 transactions.
Q2: Which countries dominate the imported alcohol market?
India and Brazil lead the imported alcohol trade, followed by Russia, Colombia, and Mexico, showing strong demand from emerging markets.
Category
Leave Message for Demo Request or Questions
















