
Top Global Spices importer by Country & Company - Tendata
 Import News
 2026-03-30
Keypoints
· Large-Scale and High-Value Market
The global imported alcohol market reached $9.73 billion in total trade value, supported by 30,801 importers and 641,614 transactions. This reflects a highly liquid and commercially significant sector with strong cross-border demand.
· Highly Fragmented Buyer Landscape
With over 30,000 importers across 126 countries, the market shows a decentralized structure, where distributors, wholesalers, and retailers all participate. This creates multiple entry points for exporters targeting different buyer tiers.
· Global Demand Distribution with Growth Potential
The presence of 126 importing countries demonstrates that alcohol consumption is globally widespread, with both mature markets and emerging economies contributing to growth, offering exporters scalable expansion opportunities.
The global spices importer market plays a vital role in supporting the food industry, food processing, retail, and catering sectors worldwide. From basic raw spices such as pepper, turmeric, and cumin to high-value processed blends and seasonings, spice imports are essential to global supply chains and consumer demand. As international cuisine continues to diversify and processed food consumption rises, the spices trade has become a key driver of cross-border agricultural commerce.

Overview of the Global spices Import Market
The global spices importer market continues to expand steadily, driven by rising demand from the food processing, retail, and foodservice industries. According to Tendata trade data, the market in 2025 involves 30,801 importers across 126 countries, generating a total import value of $9.73 billion from 641,614 trade transactions, reflecting a highly active and globally distributed trade ecosystem.
From a classification perspective, spices are primarily categorized under HS Chapter 09 (e.g., HS 0904–0910), covering products such as pepper, chili, cumin, cinnamon, and mixed spices . This wide HS coverage highlights the diversified product structure of the spices trade, ranging from raw agricultural commodities to processed seasoning blends used in industrial food production.
The scale and transaction volume indicate a high-frequency and fragmented market, where import activities are driven by continuous replenishment cycles and seasonal demand fluctuations. Meanwhile, the presence of over 30,000 importers suggests a decentralized buyer landscape, offering significant opportunities for exporters to penetrate niche markets and build long-term supply relationships.
List of Major spices Importing HS Codes
According to Tendata global trade data, here is the list of top auto part HS Codes in 2025
1.9103000($5,160,862.19,5.00%):Spices, of turmeric (Curcuma)
2.9103001($4,769,508.55,4.62%):Dried peppers (of genus Capsicum)
3.9103002($4,463,952.96,4.32%):Spices, Cumin seeds, neither crushed nor ground. (excl. cumin powder)
4.9103003($4,270,849.78,4.14%):Spices, not elsewhere specified (nes)
>>Get A Free Demo<<
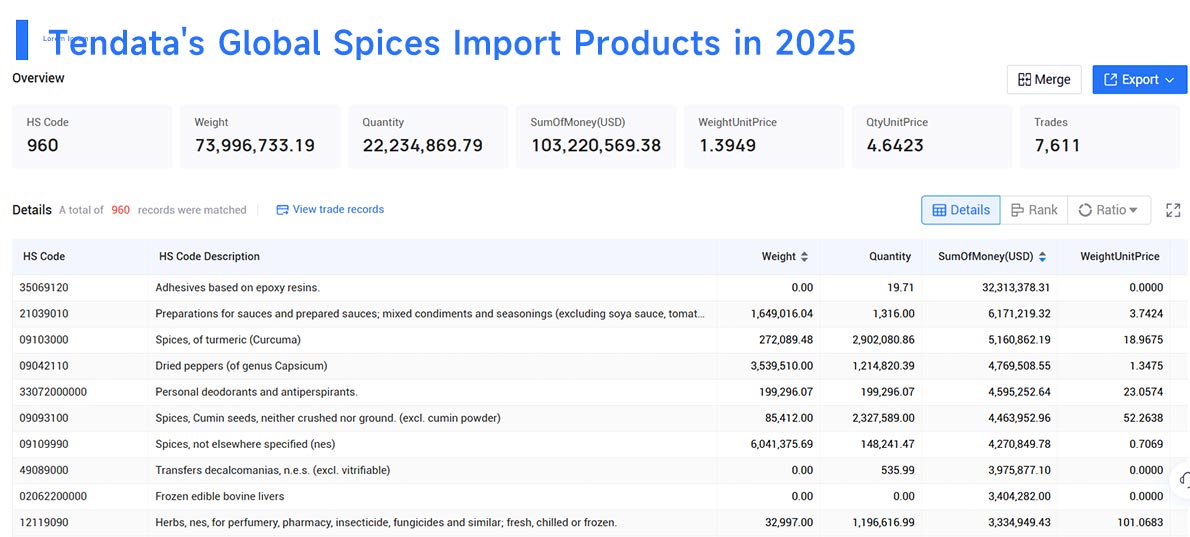
From a trade data perspective, these HS codes reveal a diversified demand structure within the imported alcohol sector. Beer and wine dominate volume-driven consumption markets, while high-purity ethyl alcohol and whisky reflect industrial use and premium consumption trends.
Using Tendata’s trade data tools, businesses can further drill down into buyer lists, shipment frequency, and country-specific demand for each HS code, enabling more precise market entry and customer targeting strategies.
Top Spices Importing Countries
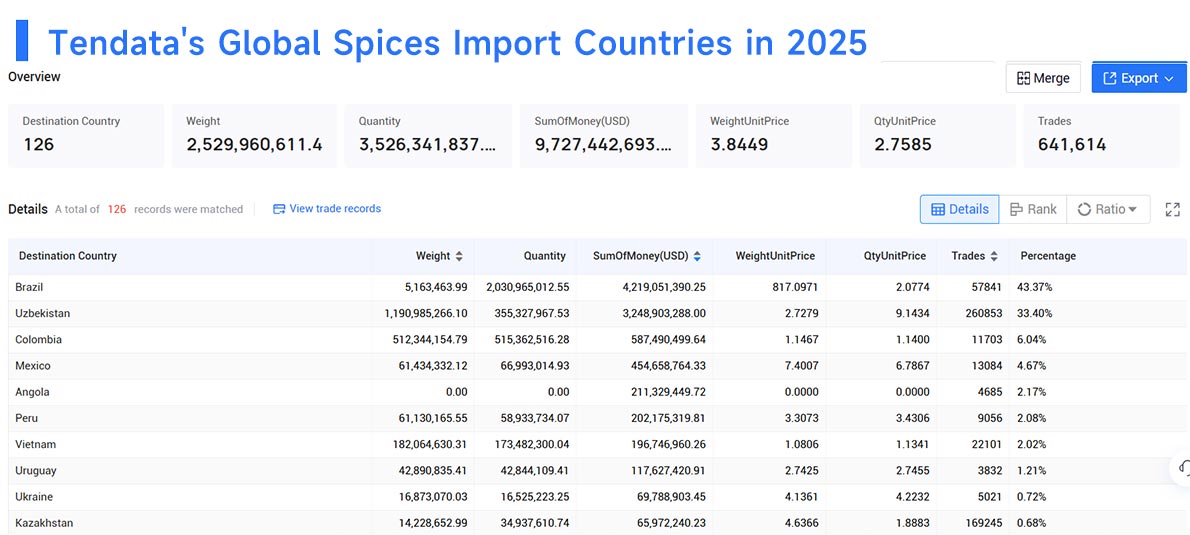
According to Tendata global trade data, below is the list of major spices importing countries in 2025:
1.Brazil (43.37%, $4,219.05 Million)
2.Uzbekistan (33.40%, $3,248.90 Million)
3.Colombia (6.04%, $587.49 Million)
4.Mexico (4.67%, $454.66 Million)
5.Angola (2.17%, $211.33 Million)
6.Peru (2.08%, $202.18 Million)
7.Vietnam (2.02%, $196.75 Million)
8.Uruguay (1.21%, $117.63 Million)
9.Ukraine (0.72%, $69.79 Million)
10.Kazakhstan (0.68%, $65.97 Million)
>>Get A Free Demo<<
Top Global Spices Importers in 2025
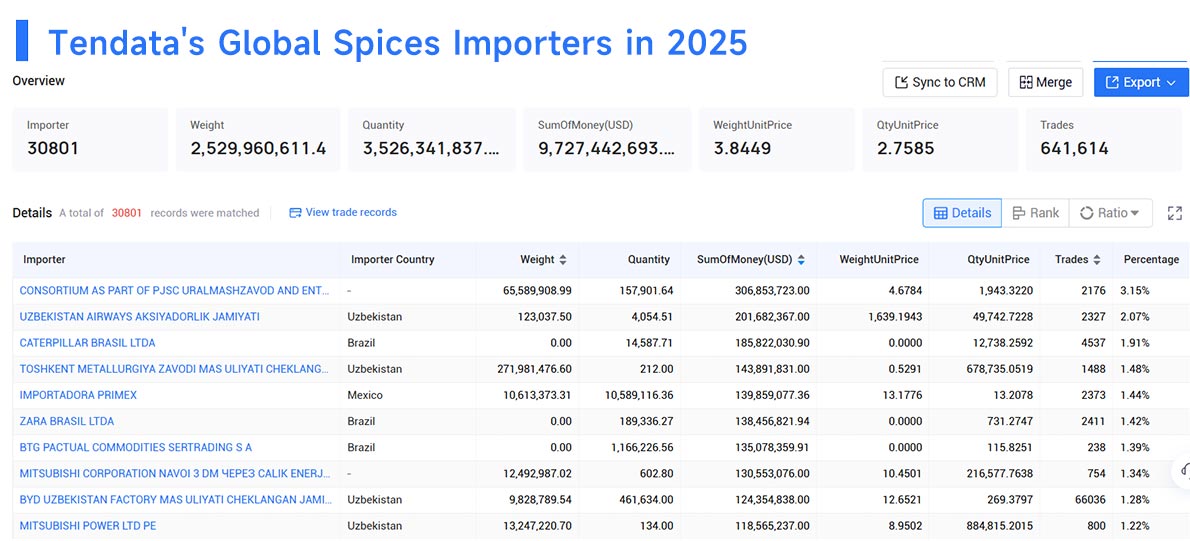
According to Tendata global trade data, here is the list of top spices importers worldwide in 2025:
1.CONSORTIUM (3.15%, $306.85 Million)
2.UZBEKISTAN (2.07%, $201.68 Million)
3.TOSHKENT ME (1.48%, $143.89 Million)
4.IMPORTADORA (1.44%, $139.86 Million)
5.MITSUBISHI CO (1.34%, $130.55 Million)
>>Get A Free Demo<<
How to Find Spices Import Data with Tendata?
Users can search by product keywords, or target markets to access shipment-level records that include importer names, trade values, quantities, origin countries, and port details. These datasets are typically aggregated from customs authorities, logistics systems, and statistical agencies, ensuring visibility into actual transaction flows rather than estimates.
With Tendata, businesses can go beyond basic statistics by identifying active spices importers with consistent purchasing behavior, analyzing their sourcing countries, frequency of orders, and pricing trends. This allows exporters to prioritize high-potential buyers, monitor competitor shipments, and adjust market strategies based on real demand signals.
Finding reliable spices importer data requires access to detailed, transaction-level trade records rather than just aggregated statistics. According to industry data platforms, high-quality import-export databases typically provide importer names, shipment records, HS codes, pricing, and origin-destination details, enabling businesses to identify real buyers and market opportunities .
Tendata applies a similar but more advanced multi-source approach. By integrating global customs data, logistics information, and commercial datasets, it allows users to accurately track spices import flow across 228+ countries.
Final Words
The global spices importer market in 2025 demonstrates strong depth, scale, and resilience, with 30,801 active importers across 126 countries, generating a total trade value of $9.73 billion through more than 641,000 transactions. These figures highlight a market driven by consistent consumption, frequent replenishment cycles, and broad geographic demand, making spices one of the most stable segments in agricultural trade.
FAQ
What is spices importer data and why is it important?
Spices importer data refers to detailed records of companies importing spice products under HS Chapter 09 (e.g., pepper, cumin, turmeric, cinnamon), including shipment values, quantities, and supplier origins. This data is critical because it helps exporters identify real buyers, active markets, and demand trends instead of relying on assumptions.
How can I find reliable spices importers globally?
The most effective way is to use global trade data platforms like Tendata. These platforms aggregate customs records and logistics data to provide verified importer names, transaction history, and purchasing frequency, allowing you to filter out inactive or low-quality leads.
Can I use Tendata to analyze specific spice products?
Yes. Tendata allows you to drill down into specific HS codes within Chapter 09, such as pepper (0904), cumin seeds (0909), or turmeric (0910), helping you identify product-specific buyers and niche opportunities in different markets.
Category
Leave Message for Demo Request or Questions
















