
Top 10 Cookies Imported by Country & Company & Product- Tendata
 Import News
 2026-03-31
Keypoints
·Strong Market Scale with Stable Demand
The global cookies imported market reached nearly USD 2.0 billion in trade value, supported by 17,018 importers and 581,342 transactions, indicating a highly active and liquid international trade environment driven by everyday consumption.
·Wide Geographic Coverage Enhances Market Diversification
With imports spanning 111 destination countries, the cookies imported market demonstrates strong global penetration, allowing suppliers to diversify risk and tap into both mature markets and emerging consumption regions.
·Data-Driven Strategy is Key to Market Success
Given the scale and complexity of the cookies imported trade, using detailed import data (such as buyer activity, pricing trends, and supplier networks) is essential for identifying high-potential markets and optimizing global expansion strategies.

Overview of the Global Cookies Import Market
The global cookies imported market plays a vital role in supporting the fast-moving consumer goods sector, retail distribution, and international food supply chains across the world. From everyday packaged biscuits to premium and specialty snack products, cookies imported contribute significantly to global trade flows and consumer demand. Understanding the key importing countries, major buyers, and product categories provides valuable insight into market demand patterns, sourcing strategies, and evolving consumption trends. This blog explores the cookies imported market based on global trade data, highlighting leading importing countries, active buyers, trade volumes, relevant HS Codes, and other key trends shaping the global cookies trade landscape.
Global Cookies Import Data: 2025 Analysis
According to Tendata global trade data, the cookies imported market in 2025 demonstrates a highly active and globally diversified trade structure. With 17,018 importers across 111 destination countries, the market generated a total trade value of USD 1.99 billion from 581,342 transactions, indicating strong cross-border demand and frequent procurement cycles.
From a trade perspective, the high transaction volume suggests that cookies imported is characterized by repeat purchasing behavior, short replenishment cycles, and stable consumption patterns—especially in mature consumer markets and fast-growing emerging economies. This combination of broad importer participation + high-frequency trade flows makes the cookies segment a resilient and scalable category within global food trade.
List of Major Cookies Importing HS Codes
According to Tendata global trade data, here is the list of top cookies HS Codes in 2025
1.HS Code:19053201(7.32%, $0.15 Billion):Wafers and wafers, whether or not filled (gaufrettes) and waffles.
2.HS Code:19053101(6.70%, $0.13 Billion):Biscuits, wafers and cakes (excl. pastry and confectionery)
3.HS Code:19053100(6.04%, $0.12 Billion):Biscuits, sweet (excl. wafers)
4.HS Code:19059090(3.53%, $0.07 Billion):Bread, pastry, cakes, biscuits and other bakers' wares, whether or not containing cocoa; communion wafers, empty capsules of a kind suitable for pharmaceutical use, sealing wafers, rice paper and similar products (excluding crispbread, gingerbread and the like)
5.HS Code:19053200(3.34%, $0.07 Billion):Waffles and wafers (excl. those made from flour, sugar, butter or other ingredients, containing 2% or more by weight of fat)
6.HS Code:19053190(2.69%, $0.05 Billion):Bread, pastry, cakes, biscuits and other bakers' wares (excl. confectionery)
7.HS Code:19012099(2.40%, $0.05 Billion):Mixtures and pastes for the preparation of bakery products, pastry, cakes, biscuits, waffles and other bakers' wares.
8.HS Code:18069090(1.99%, $0.04 Billion):Chocolate and other preparations containing cocoa, in containers or immediate packings of <= 2 kg (excl. in blocks, slabs or bars and cocoa powder)
9.HS Code:19053110(1.98%, $0.04 Billion):Biscuits, sweet, not containing cocoa (excl. those with a covering or coating of chocolate)
10.HS Code:19059099(1.29%, $0.03 Billion):Bakery, pastry or biscuit products, incl. with added cocoa; hosts, empty seals of a kind used for medicines, sealing wafers, dry pastes of flour, starch, in sheets, and similar products (excl. "Knäckebrot", gingerbread, sweet biscuits)
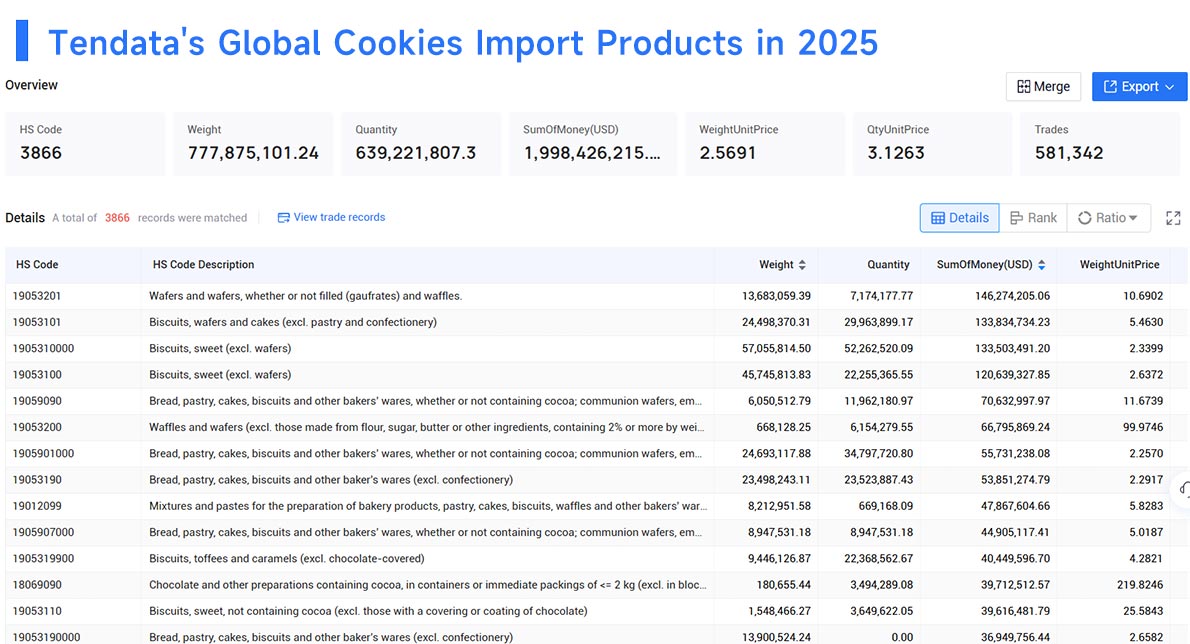
The structure of the global cookies imported market can be clearly understood through key HS Codes, which reveal both product segmentation and demand distribution across international trade. According to Tendata global trade data, HS Code 19053201 (wafers and waffles) leads the category with a 7.32% share, reaching approximately $0.15 billion, indicating strong global demand for layered and filled wafer products. This is followed by 19053101 (biscuits, wafers and cakes, excl. pastry and confectionery) at 6.70% ($0.13 billion) and 19053100 (sweet biscuits, excl. wafers) at 6.04% ($0.12 billion), which together form the core of traditional cookies imported product flows.
Beyond these primary segments, diversified bakery categories such as 19059090 and 19053190 highlight the inclusion of broader baked goods within the cookies imported trade ecosystem, reflecting cross-category consumption patterns. Meanwhile, niche but high-value segments like 18069090 (chocolate-containing preparations) and 19053110 (non-cocoa sweet biscuits) demonstrate increasing consumer preference for premium and specialized products.
Overall, the HS Code distribution shows that the cookies imported market is not limited to standard biscuits but extends across wafers, chocolate-coated products, and bakery mixes. For exporters and suppliers, leveraging HS Code-level trade data is essential to identify high-demand product categories, optimize product positioning, and align with evolving global consumption trends in the competitive snack food industry.
Top Cookies Importing Countries
According to Tendata global trade data, below is the list of major cookies importing countries in 2025:
1.Mexico (24.77%, $494.93 Million)
2.Brazil (13.70%, $273.71 Million)
3.Ukraine (8.19%, $163.75 Million)
4.Colombia (8.03%, $160.51 Million)
5.Vietnam (5.06%, $101.16 Million)
6.Kazakhstan (4.87%, $97.41 Million)
7.Dominican Republic (4.20%, $84.02 Million)
8.Uzbekistan (3.39%, $67.67 Million)
9.Peru (3.16%, $63.12 Million)
10.Panama (2.90%, $57.88 Million)
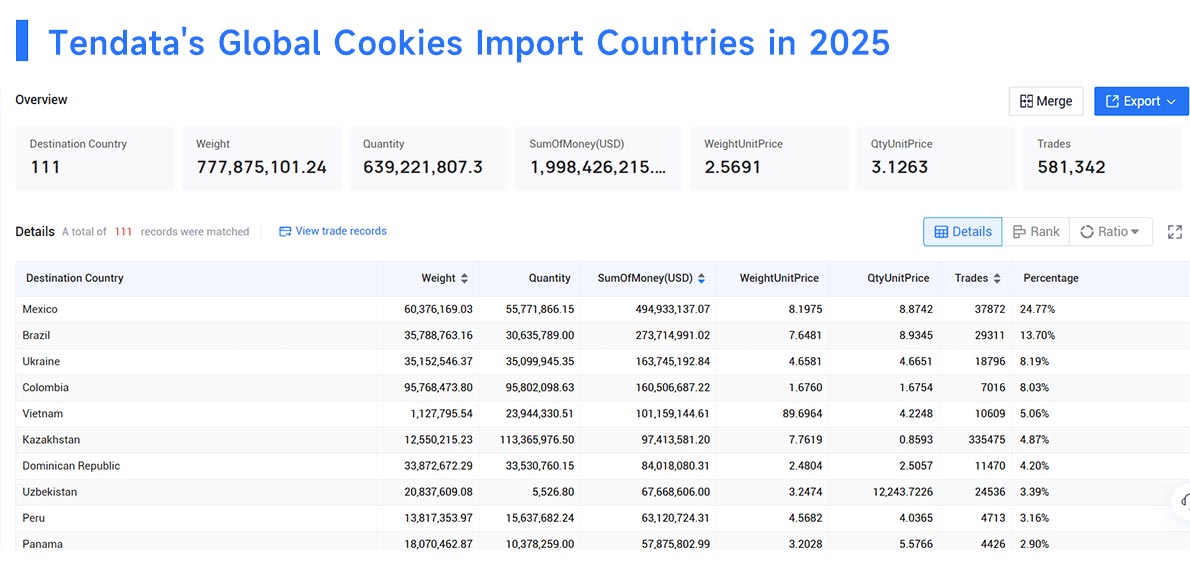
The global cookies imported market in 2025 demonstrates a clear concentration of demand across emerging and high-consumption economies, reflecting strong growth in packaged food and snack sectors. According to Tendata trade data, Mexico leads the global cookies imported landscape with a dominant 24.77% share, totaling approximately $494.93 million, driven by robust retail demand and expanding distribution networks. Brazil follows with 13.70% ($273.71 million), supported by its large consumer base and growing appetite for branded confectionery products.
Mid-tier importing countries such as Ukraine (8.19%) and Colombia (8.03%) highlight steady demand in Eastern Europe and Latin America, while Vietnam (5.06%) represents a fast-growing Southeast Asian market fueled by urbanization and rising disposable income. Additionally, countries like Kazakhstan, the Dominican Republic, and Uzbekistan collectively indicate expanding regional trade flows and increasing penetration of imported snack foods.
Top Global Cookies Importers in 2025
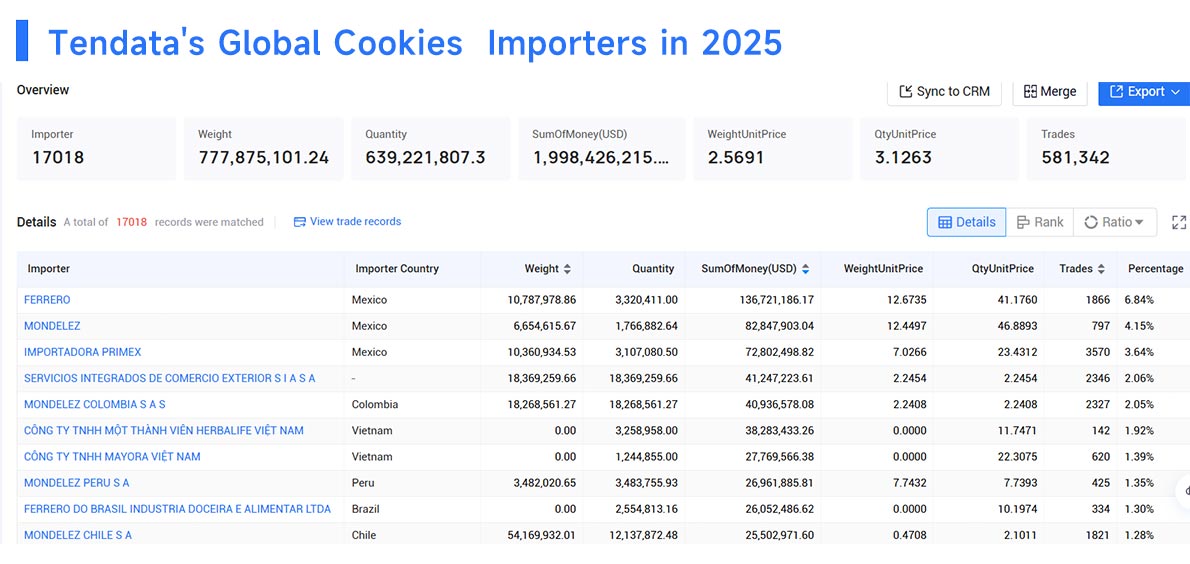
According to Tendata global trade data, here is the list of top cookies importers worldwide in 2025:
FERRERO (6.84%, $136.72 Million)
MONDELEZ (4.15%, $82.85 Million)
IMPORTADORA PRIMEX (3.64%, $72.80 Million)
SERVICIOS INTEGRADOS DE COMERCIO EXTERIOR S I A S A (2.06%, $41.25 Million)
MONDELEZ COLOMBIA S A S (2.05%, $40.94 Million)
CÔNG TY TNHH MỘT THÀNH VIÊN HERBALIFE VIỆT NAM (1.92%, $38.28 Million)
CÔNG TY TNHH MAYORA VIỆT NAM (1.39%, $27.77 Million)
MONDELEZ PERU S A (1.35%, $26.96 Million)
FERRERO DO BRASIL INDUSTRIA DOCEIRA E ALIMENTAR LTDA (1.30%, $26.05 Million)
How to find Cookies Products Import Data?
With platforms like Tendata, the process of finding cookies imported data becomes significantly more efficient and data-driven. Users can simply enter product keywords such as “cookies” or relevant HS codes to instantly retrieve global import records across 200+ countries. The platform then allows filtering by destination country, supplier origin, and time range, enabling precise market segmentation and opportunity identification.
More importantly, Tendata provides transaction-level insights—including importer names, shipment volumes, prices, frequency, and trading partners—helping businesses identify high-value buyers and understand real purchasing behavior. For example, companies can analyze which importers are consistently active in the cookies imported market, track their replenishment cycles, and directly access key decision-makers’ contact information for targeted outreach.
Final Words
For businesses looking to succeed in the cookies imported market, relying on accurate and granular trade data is no longer optional. Platforms like Tendata enable companies to move beyond surface-level insights by identifying real buyers, tracking purchasing frequency, and uncovering emerging demand trends across different markets. By leveraging these insights, exporters can reduce market entry risks, optimize customer targeting, and build sustainable growth strategies.
Ultimately, in an increasingly competitive global food trade environment, those who can effectively combine cookies imported data with actionable intelligence will be best positioned to capture new opportunities and achieve long-term success.
FAQ
1.What is the best way to find reliable cookies imported data?
The most effective way to access cookies imported data is by using structured trade databases that provide shipment-level insights. These platforms allow users to search by HS codes (such as 190531 for sweet biscuits and cookies), keywords, or countries to retrieve detailed import records, including buyers, suppliers, prices, and volumes . Compared to traditional statistical reports, this approach offers much deeper visibility into real trade flows.
2.How does Tendata help analyze the cookies imported market?
Tendata simplifies the analysis of cookies imported by integrating global customs data from 200+ countries and transforming it into actionable insights. Users can filter by country, time range, HS code, or buyer activity to identify high-potential markets, track demand trends, and monitor competitors. The platform’s AI-powered tools further enhance decision-making by highlighting key buyers, procurement cycles, and pricing benchmarks.
3. Can Tendata help me find real buyers for cookies imported?
Yes. One of Tendata’s core advantages is its ability to identify verified, active importers in the cookies imported market. By analyzing transaction frequency and historical shipment records, users can pinpoint buyers with stable purchasing behavior and directly access key decision-makers, significantly improving outreach efficiency and conversion rates.
Category
Leave Message for Demo Request or Questions
















