
Philippines Imports Market Overviews in 2025 - Tendata
 Import News
 2026-04-24
In 2025, the Republic of the Philippines recorded approximately $141.7 billion in total imports, reflecting strong demand for goods from global suppliers.
This figure represents a 13.9% increase compared to 2021, when imports stood at $124.4 billion. On a year-over-year basis, imports grew by 5.1% from $134.9 billion in 2024, indicating steady expansion in trade activity.
Over the same period, the Philippine peso weakened by 14.3% against the US dollar, making imported goods more expensive for local buyers when priced in foreign currency.
Major Suppliers to the Philippines
According to the latest trade data, 83.2% of the Philippines’ imports were sourced from the following key partners:
· Mainland China (28.4%)
· South Korea (7.9%)
· Japan (7.88%)
· Indonesia (7.7%)
· United States (6.2%)
· Thailand (5.5%)
· Singapore (4.21%)
· Malaysia (4.19%)
· Vietnam (4.14%)
· Taiwan (3.5%)
· Australia (1.9%)
· Germany (1.6%)
From a regional perspective, Asia dominated as the primary supplier, accounting for 80.7% of total imports into the Philippines. North America contributed 7.11%, while Europe supplied 7.06%.
Smaller shares came from Oceania (2.8%), Latin America (1.8%), and Africa (0.5%).
With a population of approximately 114.4 million, total imports translate to around $1,250 per capita in 2025, slightly higher than the $1,200 recorded in 2024.
Top Product Categories in Philippines Imports
The following product groups accounted for the largest share of Philippines imports in 2025:
1. Electrical machinery and equipment: $33.5 billion (23.7%)
2. Mineral fuels including oil: $18.1 billion (12.8%)
3. Machinery including computers: $11.8 billion (8.3%)
4. Vehicles: $10.7 billion (7.5%)
5. Plastics and plastic products: $5 billion (3.6%)
6. Iron and steel: $4.8 billion (3.4%)
7. Cereals: $4.2 billion (2.9%)
8. Articles of iron or steel: $3.3 billion (2.3%)
9. Optical, technical, and medical instruments: $3.1 billion (2.2%)
10. Meat: $2.5 billion (1.8%)
Together, these categories contributed approximately 68.5% of total import value, indicating a concentration in industrial inputs, energy, and consumer goods.
Growth Trends in Philippines Imports
Among the major categories, cereals recorded the strongest growth, increasing by 106.9% from 2024 to 2025, driven by rising imports of rice, corn, and wheat.
Other notable increases included:
· Meat imports (+22.1%)
· Electrical machinery and equipment (+20.8%)
· Optical and medical instruments (+13.2%)
However, some categories experienced declines:
· Cereals (down 18.5%)
· Mineral fuels including oil (down 10.7%)
Detailed Breakdown of Philippines Imports (HS Code Level)
The above figures are based on 2-digit HS code classifications. A more detailed view at the 4-digit level shows that the largest spending categories within Philippines imports include:
1. Electronic integrated circuits and microassemblies (11.9%)
2. Refined petroleum oils (6.5%)
3. Passenger vehicles (3.7%)
4. Crude oil (2.6%)
5. Mobile phones and communication devices (2.1%)
6. Coal and solid fuels (1.9%)
7. Petroleum gases (1.7%)
8. Trucks (1.6%)
9. Solar diodes and semiconductors (1.4%)
10. Wheat (1.3%)
Philippines Importers and Market Landscape
To better understand Philippines imports, businesses can explore importer databases built on verified shipment-level data. These tools allow users to identify active buyers, analyze purchasing behavior, and connect with reliable partners.
Philippines Importers Directory
Importer directories provide detailed company profiles, including shipment history, purchasing volumes, and supply chain transparency. This enables suppliers to make informed decisions when entering the Philippine market.
Tendata offers real-time trade insights, covering product flows, buyer networks, and verified contact details based on actual import records.
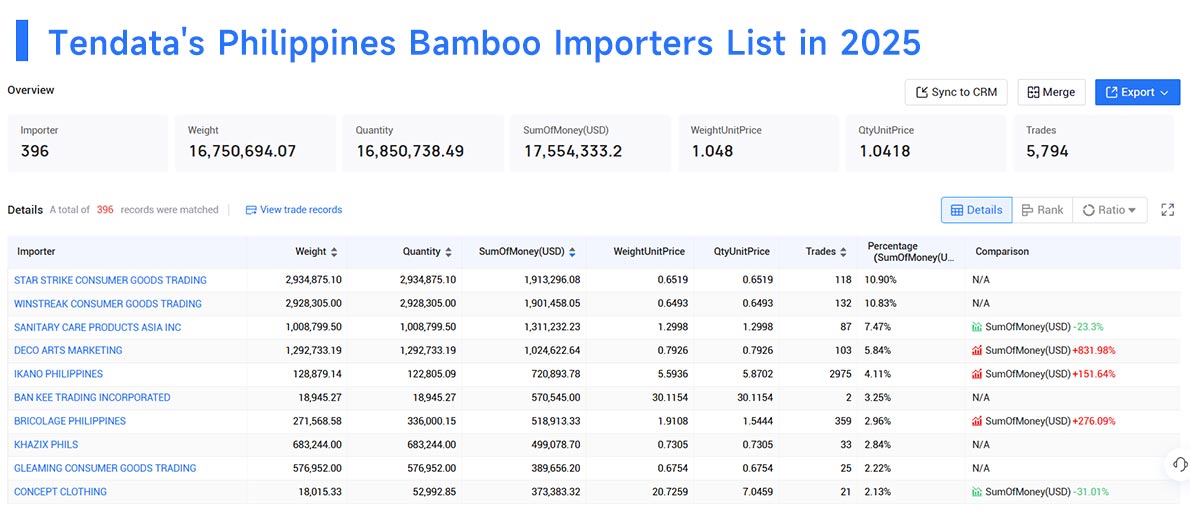
Example: Key Importers in Philippines Imports (Bamboo Sector)
Using bamboo products as an example, the leading importers in 2025 include:
>>Find More Philippines Buyers
1.STAR STRIKE CONSUMER GOODS TRADING(10.9%, $1.91 Million)
2.WINSTREAK CONSUMER GOODS TRADING(10.83%, $1.9 Million)
3.SANITARY CARE PRODUCTS ASIA INC(7.47%, $1.31 Million)
4.DECO ARTS MARKETING(5.84%, $1.02 Million)
5.IKANO PHILIPPINES(4.11%, $0.72 Million)
6.BAN KEE TRADING INCORPORATED(3.25%, $0.57 Million)
7.BRICOLAGE PHILIPPINES(2.96%, $0.52 Million)
8.KHAZIX PHILS(2.84%, $0.5 Million)
9.GLEAMING CONSUMER GOODS TRADING(2.22%, $0.39 Million)
10.CONCEPT CLOTHING(2.13%, $0.37 Million)
Category
Leave Message for Demo Request or Questions
















