Global Vitamin Exports & Imports by Country & Company in 2024 - Tendata
 Trade Data
 2025-10-15
In 2024, total global exports of vitamins reached US$5.33 billion, reflecting continued strength in the global health and nutrition market.
Compared to 2020, when exports were valued at $4.3 billion, this marks an average 23.9% increase over five years. On a yearly basis, global vitamin exports rose by 5.5% from $5.1 billion in 2023, showing consistent market expansion.
The five largest vitamin exporters — Germany, the United States, Hong Kong, India, and the Netherlands — jointly accounted for 40% of global vitamin trade in 2024.
From a continental perspective, Europe dominated the vitamin export market, generating approximately $3 billion, or 56% of total global sales. Asia followed with 21.1%, while North America contributed 14.7%. Smaller export shares came from Oceania (mainly Australia) at 4.7%, Latin America at 3.2% (excluding Mexico but including the Caribbean), and Africa with 0.3%.
On the import side, the top five importing countries in 2024 were mainland China, the United States, Russia, Germany, and Belgium, which together purchased 28% of global vitamin imports.
Interestingly, the export market is more concentrated — the top five exporters hold 40% of global trade — compared to a more diverse import market at 28%, spread across 208 import destinations and 123 exporting countries.
For trade classification, vitamins fall under the Harmonized Tariff System (HS) Code 300450, which includes medicaments containing vitamins or provitamins, natural concentrates, and derivatives.

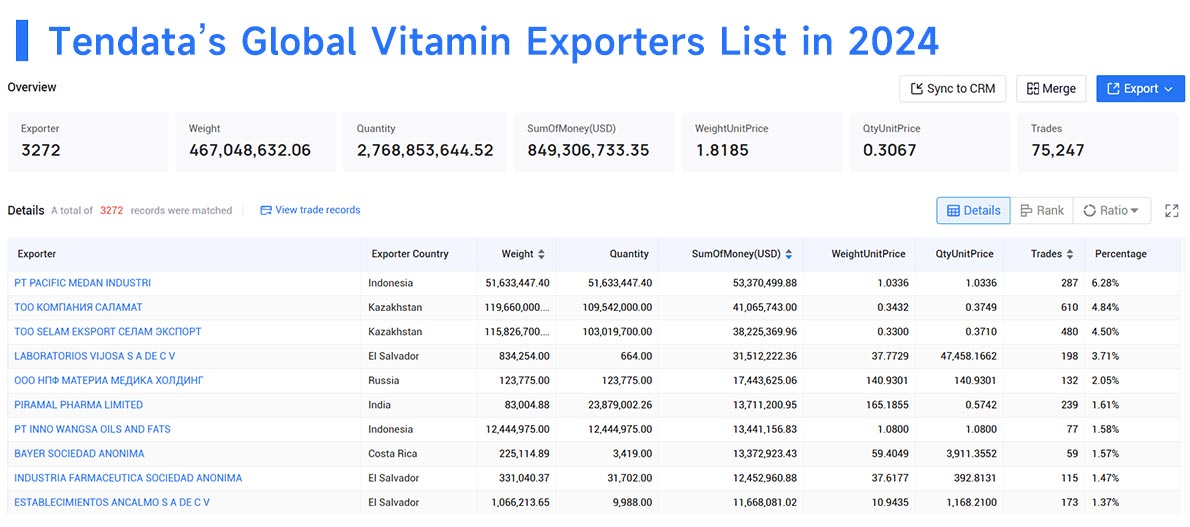
Leading Vitamin Export Companies (2024, Tendata Data)
According to Tendata global trade data, the top 10 companies exporting vitamins in 2024 were:
1.PT Pacific Medan Industri – 6.28% ($53.37M)
2.TOO Kompaniya Salamat – 4.84% ($41.07M)
3.TOO Selam Eksport – 4.5% ($38.23M)
4.Laboratorios Vijosa S.A. de C.V. – 3.71% ($31.51M)
5.OOO NPF Materia Medica Holding – 2.05% ($17.44M)
6.Piramal Pharma Limited – 1.61% ($13.71M)
7.PT Inno Wangsa Oils and Fats – 1.58% ($13.44M)
8.Bayer S.A. – 1.57% ($13.37M)
9.Industria Farmacéutica S.A. – 1.47% ($12.45M)
10.Establecimientos Ancalmo S.A. de C.V. – 1.37% ($11.67M)
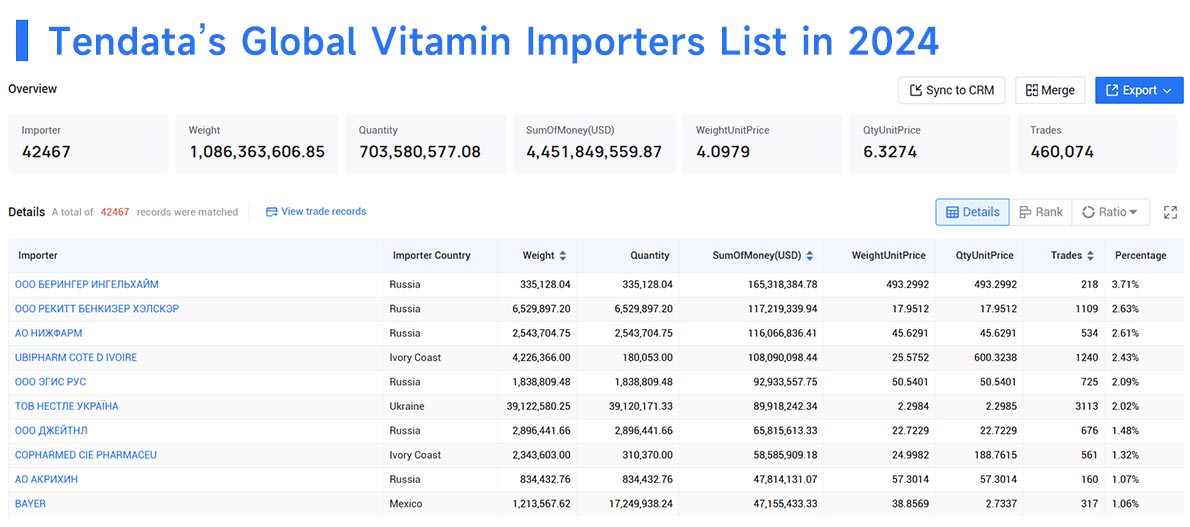
Leading Vitamin Import Companies (2024, Tendata Data)
The top 10 importing companies for vitamins in 2024 were:
1.OOO Boehringer Ingelheim – 3.71% ($165.32M)
2.OOO Reckitt Benckiser Healthcare – 2.63% ($117.22M)
3.AO Nizhpharm – 2.61% ($116.07M)
4.Ubipharm Côte d’Ivoire – 2.43% ($108.09M)
5.OOO Egis Rus – 2.09% ($92.93M)
6.Nestlé Ukraine LLC – 2.02% ($89.92M)
7.OOO Jaitnl – 1.48% ($65.82M)
8.Copharmed Cie Pharmaceutique – 1.32% ($58.59M)
9.AO Akrikhin – 1.07% ($47.81M)
10.Bayer – 1.06% ($47.16M)
Top Vitamin Exporting Countries
Below are the top 15 global exporters of vitamins in 2024, ranked by export value:
1.Germany – US$646.4 million (12.1%)
2.United States – $553.9 million (10.4%)
3.Hong Kong – $364.1 million (6.8%)
4.India – $298.1 million (5.6%)
5.Netherlands – $268.9 million (5%)
6.United Kingdom – $260.3 million (4.9%)
7.Australia – $246.8 million (4.6%)
8.Belgium – $235.2 million (4.4%)
9.France – $223.8 million (4.2%)
10.Canada – $176.3 million (3.3%)
11.Switzerland – $151 million (2.8%)
12.Poland – $150 million (2.8%)
13.Hungary – $140.4 million (2.6%)
14.Spain – $139 million (2.6%)
15.Austria – $118.7 million (2.2%)
Collectively, these 15 countries accounted for roughly 74.6% of total global vitamin exports in 2024.
The fastest-growing exporters since 2023 were:
·United Kingdom (+696.2%)
·Belgium (+139.9%)
·Poland (+36%)
·Spain (+26.5%)
Meanwhile, declines in export values were recorded in:
·Austria (-13.5%)
·Canada (-10.2%)
·France (-5.5%)
·United States (-3.4%)
·Switzerland (-1.4%)
Top Vitamin Importing Countries
Between 2020 and 2024, the total value of global vitamin imports grew by 19.2%, with a 9.9% year-over-year increase in 2024.
The 15 largest vitamin importers by total value in 2024 were:
1.Mainland China – US$415.3 million (8.2%)
2.United States – $286.1 million (5.6%)
3.Russia – $258.8 million (5.1%)
4.Germany – $232.9 million (4.6%)
5.Belgium – $223.7 million (4.4%)
6.Saudi Arabia – $212.1 million (4.2%)
7.Ireland – $179.4 million (3.5%)
8.Uzbekistan – $164.6 million (3.2%)
9.Hong Kong – $131.6 million (2.6%)
10.Canada – $128 million (2.5%)
11.Poland – $116.5 million (2.3%)
12.United Kingdom – $111.6 million (2.2%)
13.Ukraine – $103.9 million (2.1%)
14.Philippines – $103.9 million (2.1%)
15.Panama – $96.8 million (1.9%)
Together, these importers represented over 54% of global vitamin imports in 2024.
The strongest year-over-year growth in import values came from:
·Belgium (+183.3%)
·Saudi Arabia (+92.1%)
·Panama (+70.4%)
·Uzbekistan (+66.6%)
In contrast, notable declines occurred in:
·Hong Kong (-41.4%)
·Canada (-6.4%)
·Philippines (-1.1%)
Summary
The global vitamin trade continues to show steady growth, driven by rising consumer awareness around wellness and nutrition. Europe remains the leading exporter, while China and the United States dominate imports. Corporate leaders such as PT Pacific Medan Industri and Boehringer Ingelheim continue to play central roles in shaping the global supply chain.
Category
Leave Message for Demo Request or Questions