Icelandic Export Overview in 2025 - Tendata
 Export News
 2026-02-24
Located in the North Atlantic Ocean to the east of Greenland, Iceland recorded a total Icelandic export value of approximately US$7.2 billion in 2025, reflecting the country's strong performance in global trade.
Compared with 2021, when overseas shipments totaled $5.98 billion, Icelandic export revenues increased by 20.3%. On a year-over-year basis, exports rose 3.4% from $6.95 billion in 2024 to $7.2 billion in 2025.
Currency movements also played a role in shaping Icelandic export competitiveness. Based on the 2025 average exchange rate, the Icelandic króna depreciated by 7.7% against the US dollar. A weaker local currency made Icelandic export products more affordable for international buyers paying in US dollars, potentially stimulating demand.

Main Destinations for Icelandic Export Products
Recent trade data shows that 87.3% of Icelandic export shipments were purchased by importers in the following countries:
1. Netherlands (34.3%)
2. United Kingdom (10%)
3. United States (9.3%)
4. France (7.3%)
5. Spain (5.2%)
6. Germany (4.4%)
7. Norway (3.6%)
8. Poland (3%)
9. China (2.78%)
10. Lithuania (2.7%)
11. Portugal (2.6%)
12. Denmark (2.2%)
From a continental distribution perspective, 82.5% of Icelandic export value was delivered to European markets. North America absorbed 10.3%, while Asian buyers accounted for 5.2%.
Smaller shares of Icelandic export shipments went to Africa (1.1%), Oceania (0.5%)—primarily Australia—and Latin America (0.3%), excluding Mexico but including Caribbean nations.
With a population of roughly 391,000, Iceland's 2025 Icelandic export total equates to about $18,400 per capita, slightly higher than the $18,100 recorded in 2024.
Top 10 Icelandic Export Categories
The following product groups generated the highest revenue within Icelandic export trade in 2025. Percentages represent their share of total exports:
1. Fish – US$2.8 billion (39.5%)
2. Aluminum – $2.5 billion (35.5%)
3. Optical, technical and medical apparatus – $334.8 million (4.7%)
4. Food industry waste and animal feed – $185.2 million (2.6%)
5. Iron and steel – $175.2 million (2.4%)
6. Animal or vegetable fats, oils and waxes – $135.7 million (1.9%)
7. Machinery including computers – $132.8 million (1.8%)
8. Pharmaceuticals – $129.6 million (1.8%)
9. Meat and seafood preparations – $110.2 million (1.5%)
10. Mineral fuels including oil – $106.9 million (1.5%)
These ten categories represented 91.2% of total Icelandic export value, demonstrating the country's heavy reliance on a concentrated range of commodities.
Among them, fish remained the dominant Icelandic export product and achieved the strongest growth, rising 19.4% compared to 2024. Aluminum followed with a 9.5% increase, while meat and seafood preparations grew by 6.8%.
The steepest decline occurred in animal or vegetable fats, oils and waxes, which dropped by 46.6%.
All figures above are calculated at the 2-digit Harmonized Tariff System (HTS) level.
Most Valuable Icelandic Export Products (4-Digit HTS Level)
At a more detailed 4-digit HTS classification, the leading Icelandic export products in 2025 included:
1. Unwrought aluminum (30.9%)
2. Fish fillets and other fish meat (19.8%)
3. Whole fresh fish (7.8%)
4. Whole frozen fish (6.7%)
5. Dried, salted or smoked fish (4.8%)
6. Orthopedic appliances (3.7%)
7. Aluminum wire (3.5%)
8. Inedible meat flour (2.5%)
9. Ferroalloys (2.2%)
10. Fish or marine mammal fats and oils (1.6%)
Finding Suppliers Through Icelandic Export Data
For companies seeking to expand within the Icelandic export market, identifying trustworthy suppliers is essential. By leveraging Tendata's advanced tools—such as keyword search and HS code filtering—businesses can efficiently discover verified exporters, analyze shipment trends, and access contact details to accelerate market development.
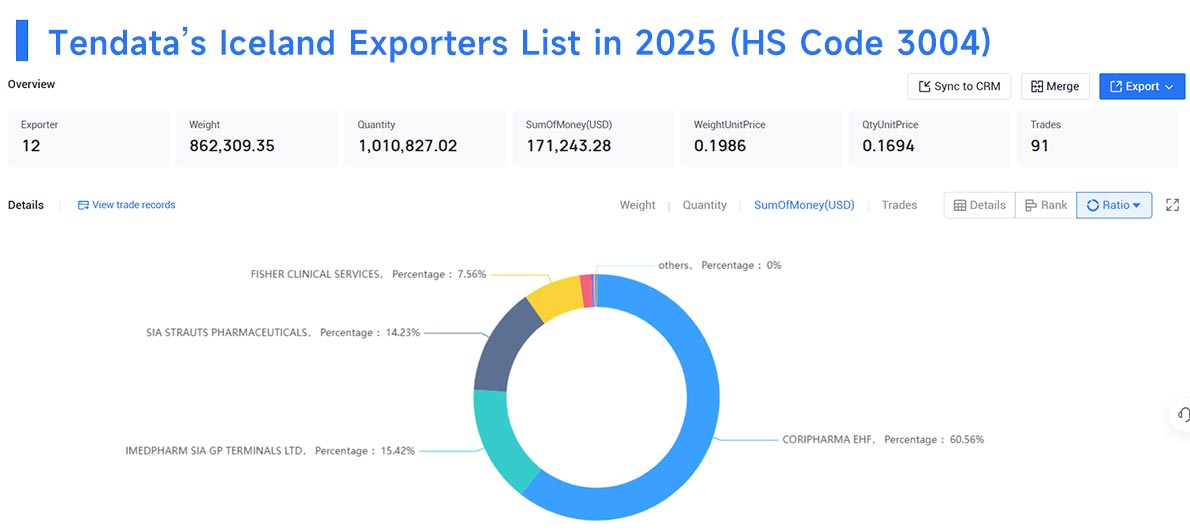
For example, when analyzing HS Code 3004 demand, Tendata can quickly identify the top pharmaceutical-related suppliers in Iceland for 2025. >>Find More Iceland Suppliers
1.CORIPHARMA EHF(60.56%)
2.IMEDPHARM SIA GP TERMINALS LTD(15.42%)
3.SIA STRAUTS PHARMACEUTICALS(14.23%)
4.FISHER CLINICAL SERVICES(7.56%)
5.ABBVIE(1.49%)
6.SANOFI(0.31%)
7.PFIZER(0.16%)
8.MEDPRO PHARMACEUTICA PTY LTD(0.14%)
9.CIPLA(0.12%)
10.CORIPHARMA(0.01%)
Whether you are an experienced trader or entering the Nordic market for the first time, leveraging Icelandic export data can help uncover promising trade opportunities. For more detailed Icelandic export statistics and supplier insights, contact Tendata to request a free online demo.
Category
Leave Message for Demo Request or Questions