Top 10 Sweden's Exports by Country & Company in 2025 - Tendata
 Export News
 2026-04-16
Situated in Northern Europe, Sweden is a Scandinavian country bordered by Norway to the west and Finland to the east, with a direct connection to Denmark via a tunnel bridge in the southwest. In 2025, Sweden's exports reached a total value of US$206.8 billion, reflecting the country's strong presence in global trade.
This figure represents a 9% increase compared to 2021, when Sweden's exports totaled US$189.6 billion. On a year-over-year basis, export value grew by 5.6%, rising from US$195.8 billion in 2024.
Sweden's five most valuable export products include automobiles, packaged pharmaceuticals, refined petroleum oils, blood fractions such as antisera, and automotive parts. Together, these key items accounted for 20% of Sweden's exports.
Based on average exchange rates in 2025, the Swedish krona appreciated slightly by 0.4% against the US dollar. Despite this modest change, currency movements still made Sweden's exports somewhat more expensive for international buyers using US dollars.

Sweden's Main Export Markets
According to the latest data, approximately 69.6% of Sweden's exports were purchased by major trading partners, including Germany (9.9%), Norway (9%), the United States (8%), Denmark (7%), Finland (6.5%), the United Kingdom (5.3%), the Netherlands (4.9%), Belgium (4.7%), Poland (4.1%), France (4%), China (3.2%), and Italy (2.8%).
From a regional perspective, Europe accounted for 72.9% of Sweden's exports, making it the dominant destination. Asia followed with 12.2%, while North America represented 10.4%.
Smaller shares of Sweden's exports were directed to Africa (2%), Latin America (1.6%), and Oceania (0.9%), with Australia and New Zealand leading in that region.
More than half (53.4%) of Sweden's exports were absorbed by fellow European Union members in 2025, slightly higher than 53.1% in 2024.
With a population of approximately 10.7 million people, Sweden's total exports in 2025 translate to about US$19,400 per capita, up from roughly US$18,400 per person the previous year.
Sweden's Leading Export Categories
The following product groups generated the highest revenues within Sweden's exports in 2025:
1.Machinery including computers: US$32.4 billion (15.7%)
2.Vehicles: US$26.9 billion (13%)
3.Electrical machinery and equipment: US$19.6 billion (9.5%)
4.Pharmaceuticals: US$14.9 billion (7.2%)
5.Mineral fuels including oil: US$13.7 billion (6.6%)
6.Paper and paper products: US$9.5 billion (4.6%)
7.Plastics and plastic articles: US$7.3 billion (3.5%)
8.Iron and steel: US$7.2 billion (3.5%)
9.Fish: US$5.7 billion (2.7%)
10.Wood: US$5.6 billion (2.7%)
These top 10 categories accounted for 69.1% of the total value of Sweden's exports.
Among them, wood showed the strongest growth, increasing by 15.6% compared to 2024. Machinery, including computers, followed with a 14.2% rise, while pharmaceuticals ranked third with a 10.6% increase.
The only declining category among the top 10 was mineral fuels, which saw a slight decrease of 1.9% year over year.
Top Exporters in Sweden
Companies looking to source products can explore databases built on real shipment data for Sweden's exports. Platforms like Tendata's Global Importers & Exporters Finder allow buyers to identify, evaluate, and connect with verified Swedish suppliers efficiently.
Sweden Exporters Directory
Exporter directories provide comprehensive insights into Sweden's exports, including shipment history, export volumes, and supply chain transparency. These tools help global buyers identify reliable partners across various industries.
Tendata also offers real-time trade intelligence on Sweden's exports, covering product details, business relationships, and verified contact information.
Sweden Exporter List Example
Tendata's database features thousands of active exporters contributing to Sweden's exports, with detailed company profiles that include location, product focus, and HS codes.
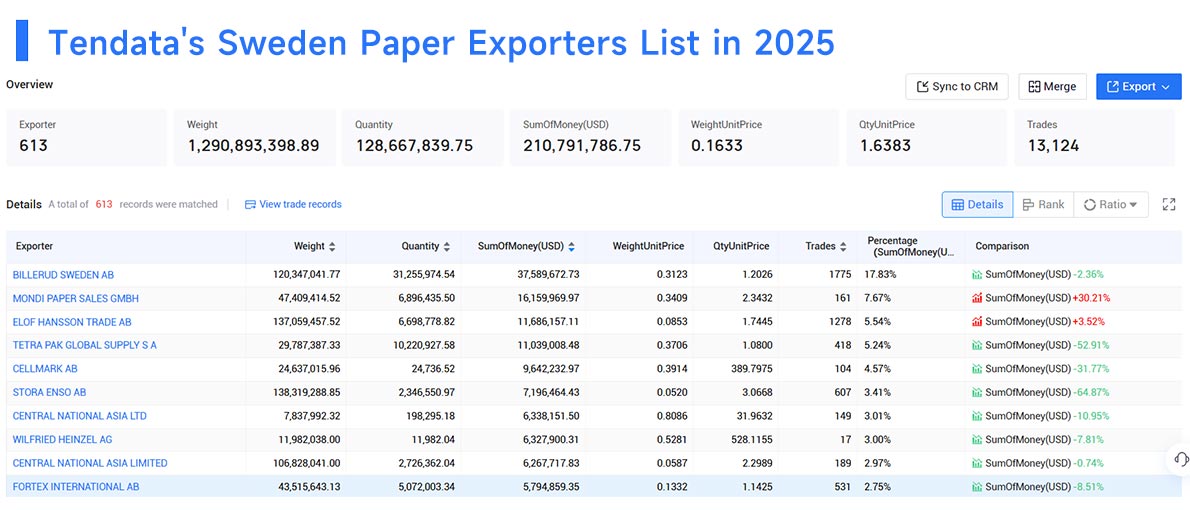
For example, in the paper industry, major Swedish exporters in 2025 included:
1.BILLERUD SWEDEN AB (17.83%, US$37.59 million)
2.MONDI PAPER SALES GMBH (7.67%, US$16.16 million)
3.ELOF HANSSON TRADE AB (5.54%, US$11.69 million)
4.TETRA PAK GLOBAL SUPPLY S.A. (5.24%, US$11.04 million)
5.CELLMARK AB (4.57%, US$9.64 million)
6.STORA ENSO AB (3.41%, US$7.2 million)
7.CENTRAL NATIONAL ASIA LTD (3.01%, US$6.34 million)
8.WILFRIED HEINZEL AG (3%, US$6.33 million)
9.CENTRAL NATIONAL ASIA LIMITED (2.97%, US$6.27 million)
10.FORTEX INTERNATIONAL AB (2.75%, US$5.79 million)
Category
Leave Message for Demo Request or Questions