Ghana's Export by Country & Company Overview (2025) - Tendata
 Export News
 2026-05-25
Located along the Gulf of Guinea on the Atlantic coast in West Africa, the Republic of Ghana recorded approximately US$22.3 billion in global export shipments in 2025.
This figure represents a 50.6% increase compared to 2021, when total exports were valued at about $14.8 billion. On a year-over-year basis, Ghana's export earnings also expanded by 8.5% from $20.6 billion in 2024.
Currency movements also played an important role in trade dynamics. The Ghanaian cedi strengthened by 52% against the US dollar since 2021, although it depreciated by -16.4% between 2024 and 2025. Compared to earlier years, the stronger local currency made Ghanaian goods relatively more expensive for foreign buyers paying in US dollars.

Ghana's Key Export Markets
Recent trade data indicates that 84.3% of Ghana's exports were absorbed by the following destinations:
· United Arab Emirates (20.4%)
· Switzerland (20.2%)
· South Africa (12.2%)
· China (7.3%)
· India (6.7%)
· Netherlands (4%)
· Canada (3.4%)
· Burkina Faso (2.5%)
· United States (2.4%)
· Italy (2%)
· Spain (1.7%)
· Brazil (1.6%)
From a regional perspective, Asia accounted for 38.5% of Ghana's export demand, followed by Europe at 33.6%. African partners absorbed 20.3%, while smaller shares went to North America (5.8%), Latin America (1.8%), and Oceania (0.1%).
With a population of around 35.1 million people, Ghana's export performance translates to roughly US$650 per capita, up from $460 in 2024.
Ghana's Top 10 Export Categories (2025)
Ghana's export structure remains highly concentrated, with the following sectors leading shipments:
1. Gems and precious metals: US$9.2B (41.1%)
2. Cocoa and cocoa products: $6.0B (26.8%)
3. Mineral fuels including oil: $3.9B (17.5%)
4. Fruits and nuts: $601.2M (2.7%)
5. Ores, slag and ash: $600.1M (2.7%)
6. Animal/vegetable fats and oils: $225.5M (1.0%)
7. Rubber and rubber products: $215.5M (1.0%)
8. Aluminum: $201.3M (0.9%)
9. Meat and seafood preparations: $183.3M (0.8%)
10. Ceramic products: $157.6M (0.7%)
Together, these top categories represented 95.2% of total export value, highlighting the concentrated nature of Ghana's export basket.
Among these sectors, cocoa and cocoa-related products recorded the strongest growth, surging 199% year over year. The ores and minerals segment followed with a 103.1% increase, driven largely by manganese exports. Fruits and nuts also expanded significantly, rising 67.6%.
In contrast, gems and precious metals declined by -19.5%, mainly due to reduced earnings from unwrought gold.
Product-Level Insights (HTS Detail)
At a more granular level, Ghana's export structure is dominated by:
· Gold (41.1%)
· Cocoa beans (26.8%)
· Crude petroleum (17.5%)
· Cocoa paste (2.7%)
· Cocoa butter and related fats (2.7%)
· Manganese ores and concentrates (1%)
· Cashew nuts and coconuts (1%)
· Processed petroleum oils (0.9%)
· Cocoa powder (0.8%)
· Natural rubber (0.7%)
Businesses seeking reliable sourcing opportunities can explore Ghana's trade network using structured export intelligence platforms such as Tendata's Global Importers & Exporters Finder. These tools help identify verified suppliers, analyze shipment flows, and evaluate trade partners based on real export records.
Ghana Exporter Directory
Tendata provides access to verified Ghana exporters with detailed shipment histories, product categories, and supply chain data. This enables importers to make more informed sourcing decisions across multiple industries.
Top Ghana Export Companies (Example: Plastics Sector)
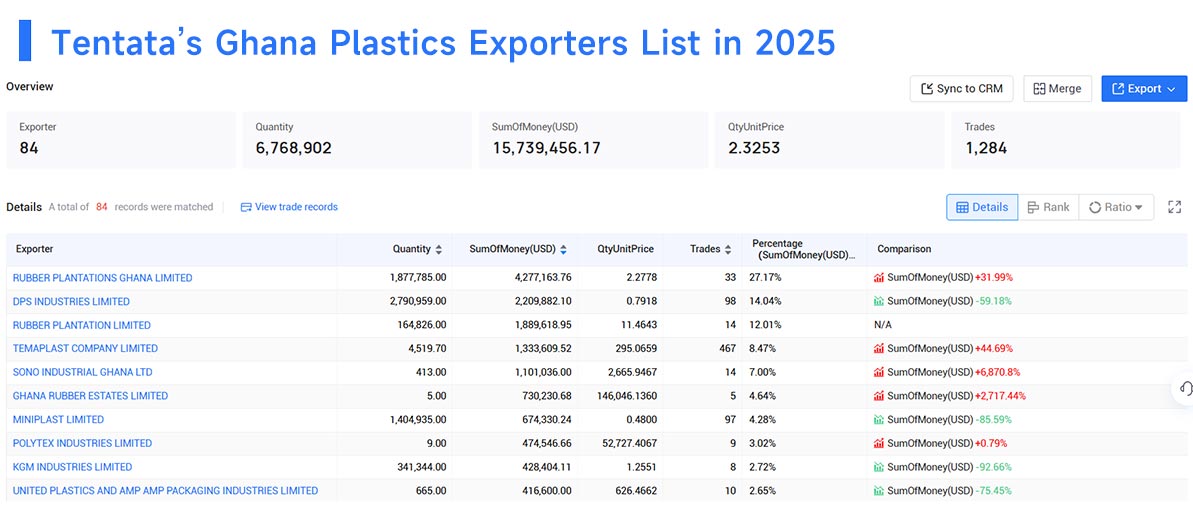
Based on Tendata ghana export data in 2025 , key exporters in Ghana's plastics-related segment include: >>Find More Ghana Exporters
1.RUBBER PLANTATIONS GHANA LIMITED (27.17%)
2.DPS INDUSTRIES LIMITED (14.04%)
3.RUBBER PLANTATION LIMITED (12.01%)
4.TEMAPLAST COMPANY LIMITED (8.47%)
5.SONO INDUSTRIAL GHANA LTD (7%)
6.GHANA RUBBER ESTATES LIMITED (4.64%)
7.MINIPLAST LIMITED (4.28%)
8.POLYTEX INDUSTRIES LIMITED (3.02%)
9.KGM INDUSTRIES LIMITED (2.72%)
10.UNITED PLASTICS AND PACKAGING INDUSTRIES LIMITED (2.65%)
Category
Leave Message for Demo Request or Questions